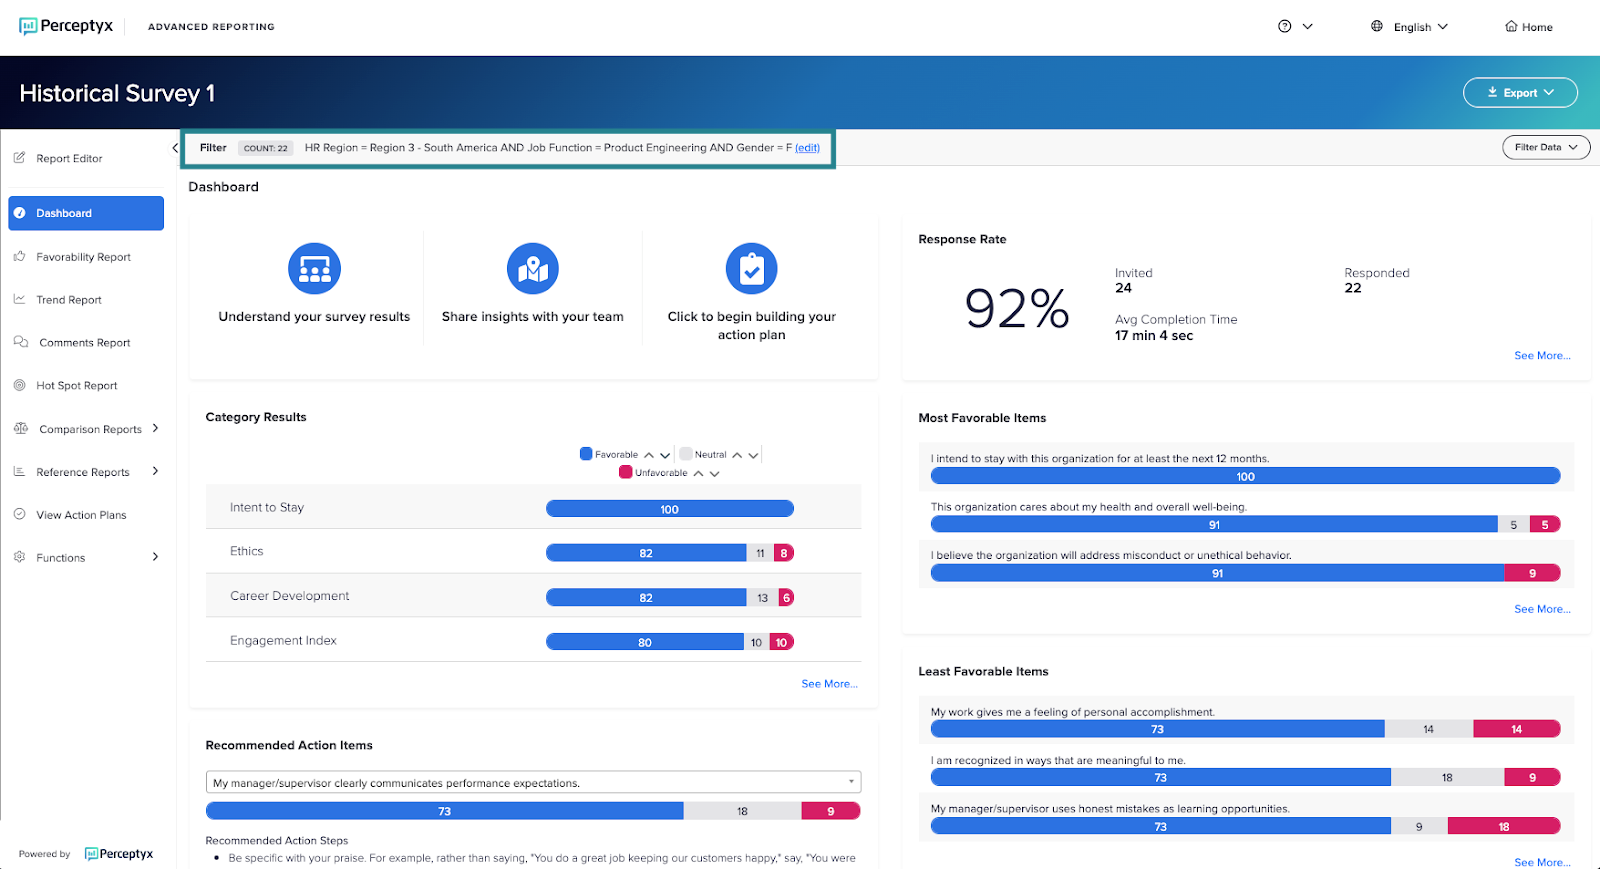
For Point-In-Time, Lifecycle, and 360 listening events you can use the Filter Data feature to narrow the scope of your results and focus on a specific segment of your respondents. Filters apply demographic variables to the listening event data; only the results that match your filter criteria are displayed. You can apply multiple demographic variables with a single filter. For example, you can create a filter that displays results only for female Product Engineers in South America. You can apply a filter to your dashboard results or a report.
Note: The Filter Data feature is available only if your data file contains demographics or if your listening event contains demographic questions.
After you create a filter, you can save it and use it at any time. When you want to return to your full set of results, simply clear the filter.
Note: When you apply a filter in one report, it automatically applies to every other report you view unless you clear the filter.
For Crowdsource events, you can use the Compare Results feature to apply demographic filters to your event report data.
This article walks through:

Create a New Filter
The steps outlined below apply to any filter you want to create. The visual examples below reflect the example mentioned above – a filter to display only female Product Engineers in South America.
Navigate to Advanced Reporting for your Point-In-Time, Lifecycle, or 360 listening event.
Click Filter Data (top right), then select New Filter.
The New Filter dialog box appears.
Click the Select a Demographic dropdown to display a list of demographics you can use in the filter.
Note: The demographics you have access to are based on role-based permissions.
Select a demographic.
The dialog box displays options associated with the selected demographic.
Select the options you want to include in the filter.
The dialog box updates to show the count (number of respondents for each selected option).
If you want to add more demographics, click Further Refine Filter, select another demographic, and then select demographic options.
As you add more demographics, the bottom of the dialog box updates the count and lists each demographic included in the filter.
Repeat as needed for any other demographics you want to include.
If your demographic selections reduce the number of respondents below the minimum threshold for showing results, the Count section indicates the count is too few to display; you will need to make a different selection.
Note: The Filter Data tool can use exclusion rule filtering to prevent users from identifying scores for groups below the minimum threshold by requiring the remainder of the filter to also meet the minimum threshold. For more details, see the Exclusion Rule Filtering article.
Click Submit Filter.
The filter is applied to your dashboard or report. The count and filter details display at the top of the page.

Save a Filter
Once you create a filter, you can save it and use it later.
Click Filter Data (top right), then select Save Filter.
The Save Filter dialog box appears.
In the Name of the Filter box, type a name for your filter.
Click Save.

Clear a Filter
Clearing a filter displays your overall results.
Note: Always reference the top of the dashboard or report page where the Count is displayed to see if a filter is applied. Until you clear a filter, any dashboard or report you view will show results only for the demographic group selected.
Click Filter Data (top right), then select Clear Filter.

Retrieve a Saved Filter
Click Filter Data (top right), then select Retrieve Saved Filter.
The Saved Filters dialog box appears, displaying all your saved filters.
Click Load for the filter you want to retrieve.
The filter is applied.
Compare Results
When viewing results for a Crowdsource listening event, you can use the Compare Results feature to apply filters to the results. Clicking Compare Results displays a list of filter options based on the employee tags specified for the event.
Click Compare Results.
The available filter options appear.
Click the dropdown for a demographic and then select an option.
Repeat for additional demographics, if desired.
Click Apply.
The results for the subset defined by your filter options display below the overall results. In the following example, a filter is applied to show results for the Finance department. For each question, the data for the Finance department displays below the overall results.
To remove a filter, click Compare Results, click Reset (top right), then click Apply.
Was this article helpful?
That’s Great!
Thank you for your feedback
Sorry! We couldn't be helpful
Thank you for your feedback
Feedback sent
We appreciate your effort and will try to fix the article


