The Favorability Report displays the percentage of participants who responded favorably or unfavorably by survey question or by category. This report also provides analysis of each question and ways for you to identify and act on important attributes for each question.
Note: The Favorability Report only reflects questions that use a favorability scale for responses. For details about how question and category scores are calculated, see the Question and Category Score Calculations article.
Note: This article reflects the default configuration for the report. If an administrator changes the default report configuration for your listening event, you might not see all the features described here.
This article walks through:
- Access the Favorability Report
- Favorability by Question
- Favorability by Categories
- Analyze Favorability Results
- Take Action
- Export Favorability Results

Access the Favorability Report
Log in to the Perceptyx Platform.
In the navigation bar, click Analyze.
In the All Reports section, use the Search Listen Event feature to find and display the listening event in the table, then click View Report for the event.
Advanced Reporting opens.
In the left panel, click Favorability Report.
The Favorability Report opens.

Favorability by Question
The Questions tab shows the percentage of participants who responded favorably or unfavorably to each survey question.
Favorable:
The percentage of respondents who selected a favorable response (Agree or Strongly Agree).Neutral:
The percentage of respondents who selected a neutral response (Neutral).Unfavorable:
The percentage of respondents who selected an unfavorable response (Disagree or Strongly Disagree).
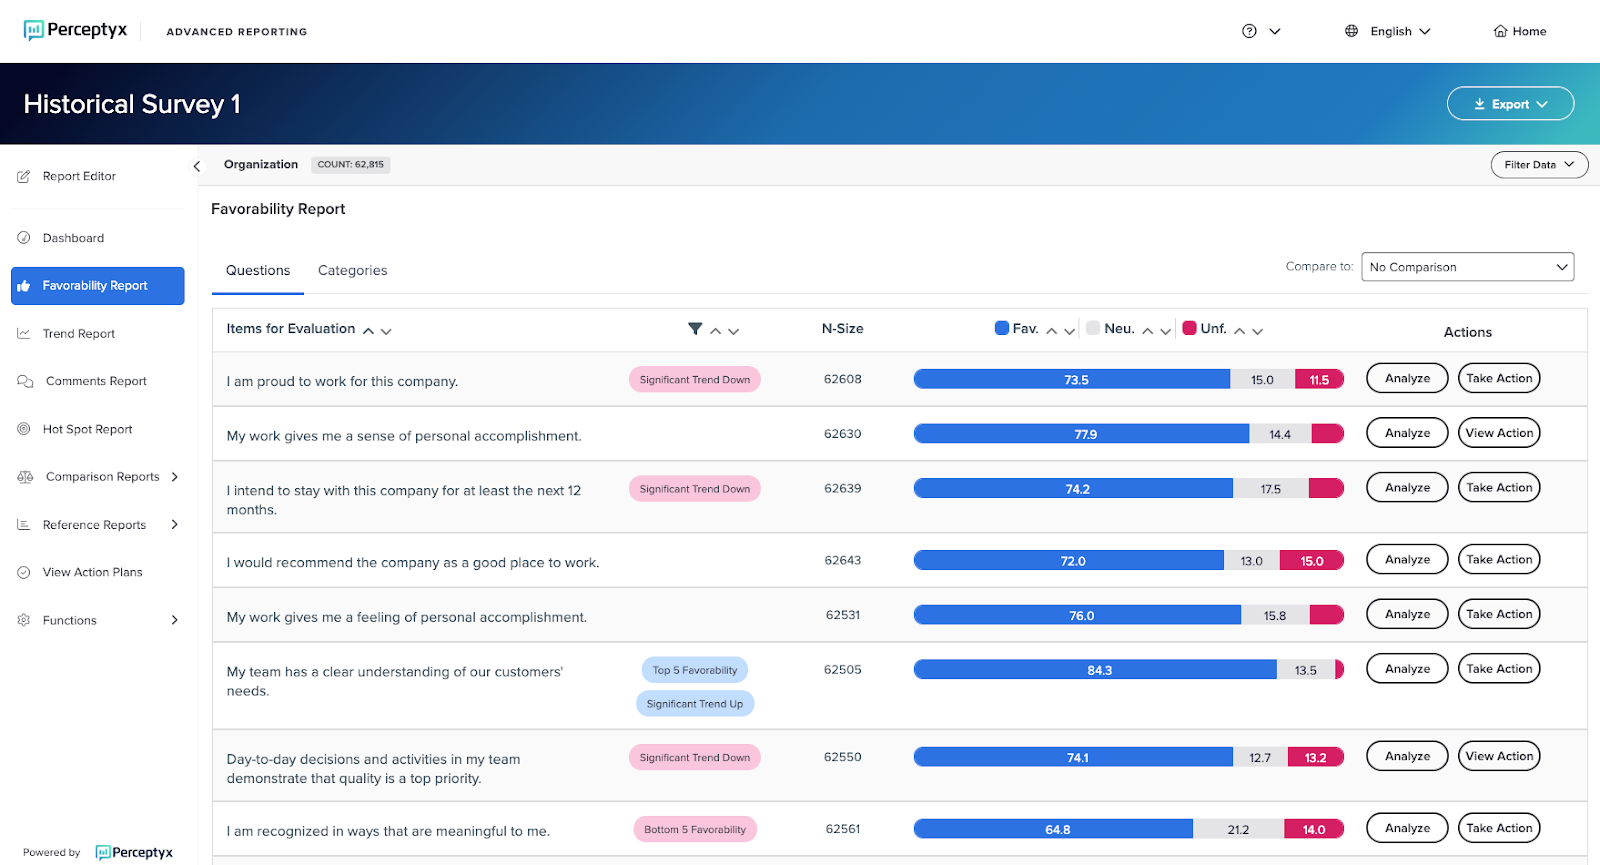
The Questions tab contains the following columns of information:

You can use the caret symbols at the top of each column within the report to sort the data by ascending or descending order.

Favorability by Categories
The Categories tab shows the percentage of participants who responded favorably or unfavorably based on the category or index questions are grouped in. This tab displays the same columns as the Questions tab, except for the Attributes column. You can click the plus sign next to a category/index to expand and view the associated questions. When you do, the Attributes column displays.


Analyze Favorability Results
Clicking the Analyze button displays a series of tabs with detailed analysis of an individual question or category. The tabs that display depend on the types of questions in your survey, your survey settings, and whether enough participants respond to meet the minimum threshold required to display results.
The following areas are available for further analysis: Drivers, Demographic Profile, Trend Report, and Comment Analysis. Select an area to interact with the data. See further information and instructions below.

Drivers Tab

The Drivers tab identifies drivers - areas that are most important to focus on to improve the selected question or category. The Perceptyx Platform uses a proprietary approach to identifying drivers called Positive Divergence Analysis. This analysis identifies employees who responded favorably to all category questions (the Highly Positive group) and all other employees (anyone who responded Neutral or Unfavorable to any question within the category). The analysis calculates the percent favorable scores on all other questions for each group and compares those scores.
The questions that show the largest difference in percent favorable scores between the two groups are considered the top drivers of the selected question or category. The top drivers represent the workplace elements that the Highly Positive employees experience to a much greater degree than other coworkers. For more details, see the Drivers of Engagement article.
You can click View More to display the information with comparison bars that show results for the Highly Positive group on top and the all other employees group below. The difference in the Favorability scores between the groups displays in the Fav. Diff. column. Understanding the key difference between the two groups will provide insight into what can be done to make your company an even better place to work.

Note: If a team does not meet the minimum response threshold to calculate drivers, the drivers shown are based on data from the next level above in the hierarchy that meets the threshold.

Demographic Profile Tab

The Demographic Profile tab displays a demographic breakdown for the question or category based on the demographic option you choose from the dropdown (top left). Demographics in your data file and demographic questions on your survey (if applicable) determine the options available in the dropdown.
Note: Demographics must be included in the survey for this tab to appear.

Trend Report Tab

The Trend Report tab displays trending of overall results based on trend configuration for your survey.
Note: Trend must be included in the survey for this tab to appear.

Comment Analysis Tab

The Comment Analysis tab displays positive and negative comments for the open-ended question you select in the dropdown (top left). You can use the Word or Phrase Search box to search all comments for a specific word or phrase and you can use the Theme Search dropdown to display comments associated with a specified theme.
Note: Comment questions must be included in the survey and sufficient number of responses required for this tab to appear.

Take Action
Clicking the Take Action button opens an action plan workflow where you can create an action plan for the selected item by specifying up to two commitments, optional notes, and up to three follow-up dates. For more information about action planning, see the Create an Action Plan article.

Export Favorability Results
You can export the report in Excel or PDF format.
Click Export (top right).
Select Export PDF or Export Excel.
Was this article helpful?
That’s Great!
Thank you for your feedback
Sorry! We couldn't be helpful
Thank you for your feedback
Feedback sent
We appreciate your effort and will try to fix the article