As participants complete events, our platform powered by AI analyzes the responses and delivers real-time reports as minimum reporting thresholds are met. Depending on your user role, you can access your listening event reports during the listening event or after it closes. (Results display only when the minimum response threshold for reporting is met.)
This article walks through:
- Access Advanced Reporting
- Advanced Reporting Overview
- Filter Your Data
- Sign Out from Advanced Reporting

Access Advanced Reporting
You can view preconfigured reports for all types of listening events using Advanced Reporting, which you can access from the Analyze page.
If reporting has recently become available, the event appears in the Recent section.
All events with reporting available appear in the All Reports section.
In some cases, a link to your most recent report may also be available directly from the Home page.
For more details on using the Analyze page, see the Analyze article.
Selecting a listening event with available reporting opens Advanced Reporting, where you can explore your data in more detail.
Access from the Analyze Page
Log in to the Perceptyx Platform.
In the navigation bar, click Analyze.
Click View Report for a listening event in its card in the Recent section (if available) or in the All Reports table.
Advanced Reporting opens, displaying results for the selected event.
Access from the Home Page
If the reporting for an event has recently become available, you may be able to access it from your Home page.
If you’re an Admin or Creator user, the Recent section of the Home page displays your four most recent events (created, modified, launched, or closed). If reporting is available for one of those events, a Live Report or View Report button displays.
If you’re a Manager or HR user, the Your Latest Results section of the Home page displays your most recent available report and a View Report button.
For more detailed information, see the Home Page article.
Log in to the Perceptyx Platform.
If necessary, navigate to the Home page.
Access your report.
Admin or Creator User:
In the Recent section, click Live Report or View Report for the applicable event.
Manager or HR User:
In the Your Latest Results section, click View Report.

Advanced Reporting Overview
Advanced Reporting helps you view and understand your preconfigured reports. What you see may differ slightly for Perceptyx-led events and self-led events:
Perceptyx-Led Events
For Perceptyx-led events, Advanced Reporting includes a dashboard that provides visual insights and summaries. It also includes a side panel with one-click access to available reports.
Self-Led Events
For self-led events, a dashboard may optionally display, depending on whether the Event Administrator or Creator has created one. Either way, you still have a side panel with full access to your preconfigured reports, which you can view, analyze, and download at any time.
Dashboard options and available reports vary based on the listening event type (Point-In-Time, Lifecycle, 360, or Crowdsource).
Point-In-Time Listening Events
For Point-In-Time listening events, the Advanced Reporting layout is consistent across both Perceptyx-led and self-led events, with the exception that a dashboard may be optional for a self-led event.
In each case, the layout is divided into two main areas:
Left Panel
Displays a list of all available reports
Remains open as you navigate, unless manually collapsed using the arrow icon at the top
Main Display Area
Displays the default dashboard, if configured
If a dashboard is not configured, one of the available reports is shown by default
In both cases, this area is where your dashboard or report content is displayed
The top-right section of the screen includes additional options to:
Filter data
Export the dashboard or reports
Access Help resources (the Knowledge Base or Customer Care)

Role-Based Access
The information you see — including the available reports and dashboard content — may vary depending on your user role.
Most dashboards include a Response Rate widget, which shows the percentage of invitees who completed the event. To learn more about response rate insights, see the Response Rates article.
For Administrator and Creator users, the left navigation panel may include the Report Editor option, which provides access to the Presentation Builder and the Dashboard Builder. To learn more about these features, see the Meet the Presentation Builder | Point-In-Time & Lifecycle and Meet the Dashboard Builder | Point-In-Time & Lifecycle articles.
In some Perceptyx-led events, managers may see a Summary Presentation (sometimes called a Manager Toolkit) available for download from the dashboard. This toolkit (available in PDF or PowerPoint format) is designed to help them share results with their teams. For information about sharing event results, see the Share Your Results article.
About Minimum Response Thresholds
If you see your manager’s results instead of your own team's results, it's likely that your team did not meet the minimum response threshold for viewing results. These thresholds ensure confidentiality.
When thresholds aren’t met:
Results are automatically rolled up to the next level in the organization
For example, if the threshold is 5 and your team has only 4 responses, you will see rolled-up results
Report Types
The types of reports available depend on:
The questions included in the survey
Whether features like trending or action planning were enabled
Below are frequently used reports for Point-In-Time events, with links to full articles for each:
Favorability Report: Shows the percentage of participants who responded favorably or unfavorably, by question or category and includes tools for identifying gaps, viewing demographics, exploring trends (if enabled), and creating action plans (if enabled).
Comments Report: Offers insights into open-text responses. Search comments by theme or keyword, view word clouds, and explore comment "hot spots."
Hot Spot Report: Highlights areas where responses are significantly higher or lower than others, which is useful for identifying focus areas.
Summary Presentation (Self-Led Only): Provides a high-level overview of category and item-level results.
Demographic Crosstab: Breaks down responses by demographics, enabling side-by-side comparison.
Benchmark Report: Compares question/category scores to internal or external benchmarks (when available).
Completion Report: Shows response rates broken down by demographic groups.
Demographic Profile: Displays the percentage of respondents by each available demographic category.
Survey Results: Offers a full view of every survey question and how participants responded, totaled and displayed in detail.
Note: You can export the dashboard content or an open report by clicking Export and then selecting Export PDF or Export Excel (only Export PDF is available for the dashboard). The content is exported in the selected format to your default download destination.
The video below provides an overview of Point-In-Time manager reports for Perceptyx-led and self-led listening events.
Lifecycle Listening Events
For Lifecycle listening events, the Advanced Reporting layout is consistent across both Perceptyx-led and self-led events, with the exception that a dashboard may be optional for a self-led event.
In each case, the layout is divided into two main areas:
Left Panel
Displays a list of all available reports
Remains open as you navigate, unless manually collapsed using the arrow icon at the top
Main Display Area
Displays the default dashboard, if configured
If a dashboard is not configured, one of the available reports is shown by default
In both cases, this area is where your dashboard or report content is displayed
The top-right section of the screen includes additional options to:
Filter data
Export the dashboard or reports
Access Help resources (the Knowledge Base or Customer Care)

Role-Based Access
The information you see — including the available reports and dashboard content — may vary depending on your user role.
Most dashboards include a Response Rate widget, which shows the percentage of invitees who completed the event and the average completion time. To learn more about response rate insights, see the Response Rates article.
Other dashboard widgets will vary based on the kind of lifecycle event (onboarding, exit, etc.).
For Administrator and Creator users, the left navigation panel may include the Report Editor option, which provides access to the Presentation Builder and the Dashboard Builder. To learn more about these features, see the Meet the Presentation Builder | Point-In-Time & Lifecycle and Meet the Dashboard Builder | Point-In-Time & Lifecycle articles.
Report Types
The types of reports available depend on:
The questions included in the survey
Whether features like trending or action planning were enabled
Below are frequently used reports for Lifecycle events, with links to full articles for each:
Favorability Report: Shows the percentage of participants who responded favorably or unfavorably, by question or category and includes tools for identifying gaps, viewing demographics, exploring trends (if enabled), and creating action plans (if enabled).
Comments Report: Offers insights into open-text responses. Search comments by theme or keyword, view word clouds, and explore comment "hot spots."
Hot Spot Report: Highlights areas where responses are significantly higher or lower than others, which is useful for identifying focus areas.
Summary Presentation (Self-Led Only): Provides a high-level overview of category and item-level results.
Demographic Crosstab: Breaks down responses by demographics, enabling side-by-side comparison.
Benchmark Report: Compares question/category scores to internal or external benchmarks (when available).
Completion Report: Shows response rates broken down by demographic groups.
NPS Report: Shows the Net Promoter Score (% Promoters - % Detractors).
Demographic Profile: Displays the percentage of respondents by each available demographic category.
Survey Results: Offers a full view of every survey question and how participants responded, totaled and displayed in detail.
Note: You can export the dashboard content or an open report by clicking Export and then selecting Export PDF or Export Excel (only Export PDF is available for the dashboard). The content is exported in the selected format to your default download destination.
360 Listening Events
For Perceptyx-led 360 listening events, the Advanced Reporting dashboard layout is similar to that used in Point-In-Time and Lifecycle events. The dashboard is divided into two main areas:
Left Panel
Displays a list of available reports
Remains open as you navigate, unless manually collapsed using the arrow icon at the top
Main Display Area
The dashboard is shown by default
This is where dashboard or report content is displayed
The top-right section of the screen includes options to:
Filter data
Export the dashboard or reports
Access Help resources (the Knowledge Base or Customer Care)
Administrator Dashboard

Participant Dashboard

Note: The reporting dashboard experience for self-led 360 listening events is separate from the experience for Perceptyx-led 360 events described above. For details, see the Participant Dashboard and Reports | 360 and Administrator Dashboard and Reports | 360 articles.
Role-Based Access
The data and reports available vary depending on your role:
Administrators can view aggregate results across all participants and filter by multiple demographics.
Participants see only their own results and can typically access a personal 360 report (PDF or PowerPoint), which helps them understand their feedback and consider next steps for development.
To learn more about participant and administrator views, see the Participant Dashboard and Reports | 360 and Administrator Dashboard and Reports | 360 articles.
Report Types
The list of reports in the left panel may vary depending on the event setup. However, most 360 events include:
Detailed Scores Report: Displays self and others’ aggregated ratings (mean scores) by item or competency.
Comments Report: Offers insights into open-text responses. For 360 events, the report does not include the Summary, Theme Co-Occurrence, Hot Spot, or Crosstab tabs.
Hot Spot Report (Admins Only): Highlights areas where responses are significantly higher or lower than others, which is useful for identifying focus areas.
Demographic Crosstab (Admins Only): Breaks down responses by demographics, enabling side-by-side comparison.
Survey Results Report: Provides a detailed view of all survey questions and responses.
Note: You can export the dashboard content or an open report by clicking Export and then selecting Export PDF or Export Excel (only Export PDF is available for the dashboard). The content is exported in the selected format to your default download destination.
The videos below provide an overview of 360 participant reports for Perceptyx-led and self-led listening events.
For Perceptyx-Led Events:
For Self-Led Events:
Crowdsource Listening Events
For Crowdsource events, the results dashboard is divided into a left panel from which you can access your profile settings and help content, and the main area where the report information displays. The information and functionality you can access is determined by your role-based permissions.

Filtering functionality is built directly into the report. In various tabs and subtabs you can use the Compare Results feature to filter by available demographics. You can also export results. For more information, see the Crowdsource Reporting for Administrators and Crowdsource Reporting for People Leaders articles.

Filter Your Data
With Point-In-Time, Lifecycle, and 360 listening events, you can use the Filter Data feature to dig deeper into results and analyze results for specific segments of the respondents. Filters apply demographic variables to the results data; only the results that match your filter criteria display.
After you create a filter, you can save it and retrieve it at any time. When you want to return to your full set of results, simply clear the filter. For more information, see the Filter Your Data article.
With Crowdsource listening events, you can use the Compare Results feature to filter results by available demographics. You can clear a filter using the Reset option. For more information, see the Crowdsource Reporting for Administrators and Crowdsource Reporting for People Leaders articles.

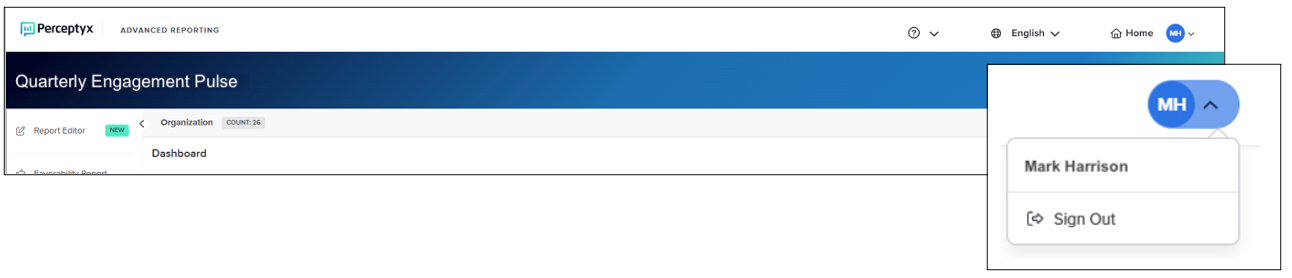
Sign Out from Advanced Reporting
When you are finished working with your reports, you can end the reporting session and continue working in the platform or you can end both the reporting session and the platform session.
To end the reporting session and continue working in the platform, click Home in the top navigation bar.
To end both the reporting session and the platform session, click your initials in the top navigation bar and then click Sign Out.
Was this article helpful?
That’s Great!
Thank you for your feedback
Sorry! We couldn't be helpful
Thank you for your feedback
Feedback sent
We appreciate your effort and will try to fix the article