There are four types of reference reports available to help you monitor completion rates, view your organization’s Net Promoter Score, see the percentage of respondents by all available demographics, and view results for each question in your survey.
This article walks through:
- Access the Reference Reports
- Completion Report
- NPS Report
- Demographic Profile Report
- Survey Results Report
- Export Option

Access the Reference Reports
Log in to the Perceptyx Platform.
In the navigation bar, click Analyze.
In the All Reports section, click View Report for the event.
Advanced Reporting opens.
In the left panel, click Reference Reports.
The Reference Reports options display.

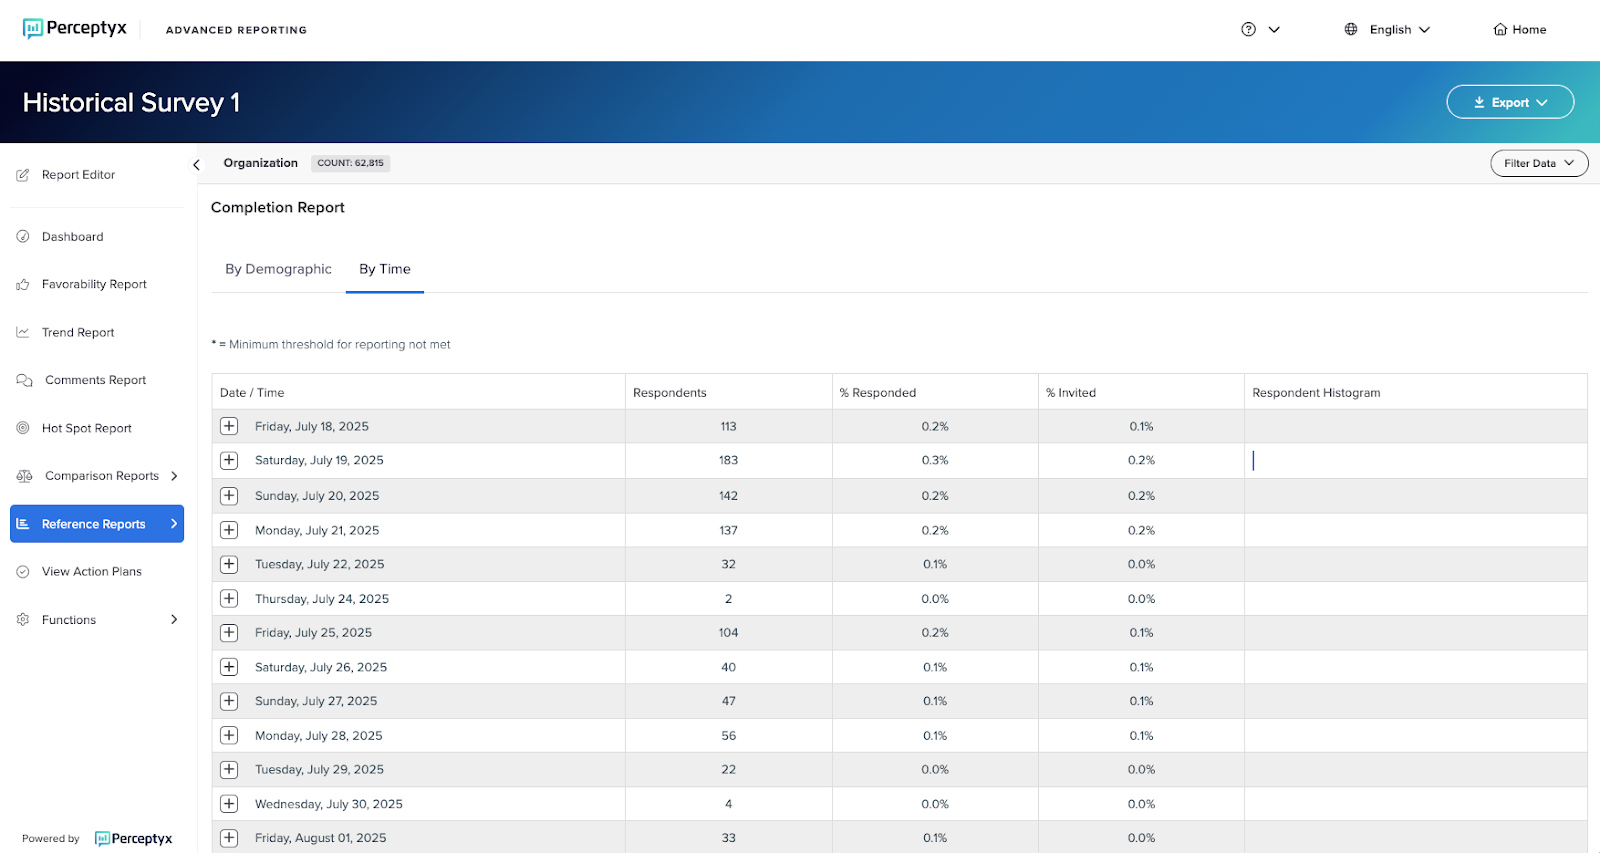
Completion Report
The Completion Report shows a breakout of response rate information by demographic groups. Click the View Type dropdown to specify a demographic. An asterisk (*) indicates that the minimum threshold for reporting has not been met; therefore, no data displays.
You can view the data by date or time (if by time is configured for the report).


NPS Report
This report is available only if your survey contains questions with an NPS scale.
The NPS Report displays the Net Promoter Score (NPS) for the organization or scope of view within the data. The NPS is calculated by taking your percentage of promoters and subtracting your percentage of detractors.


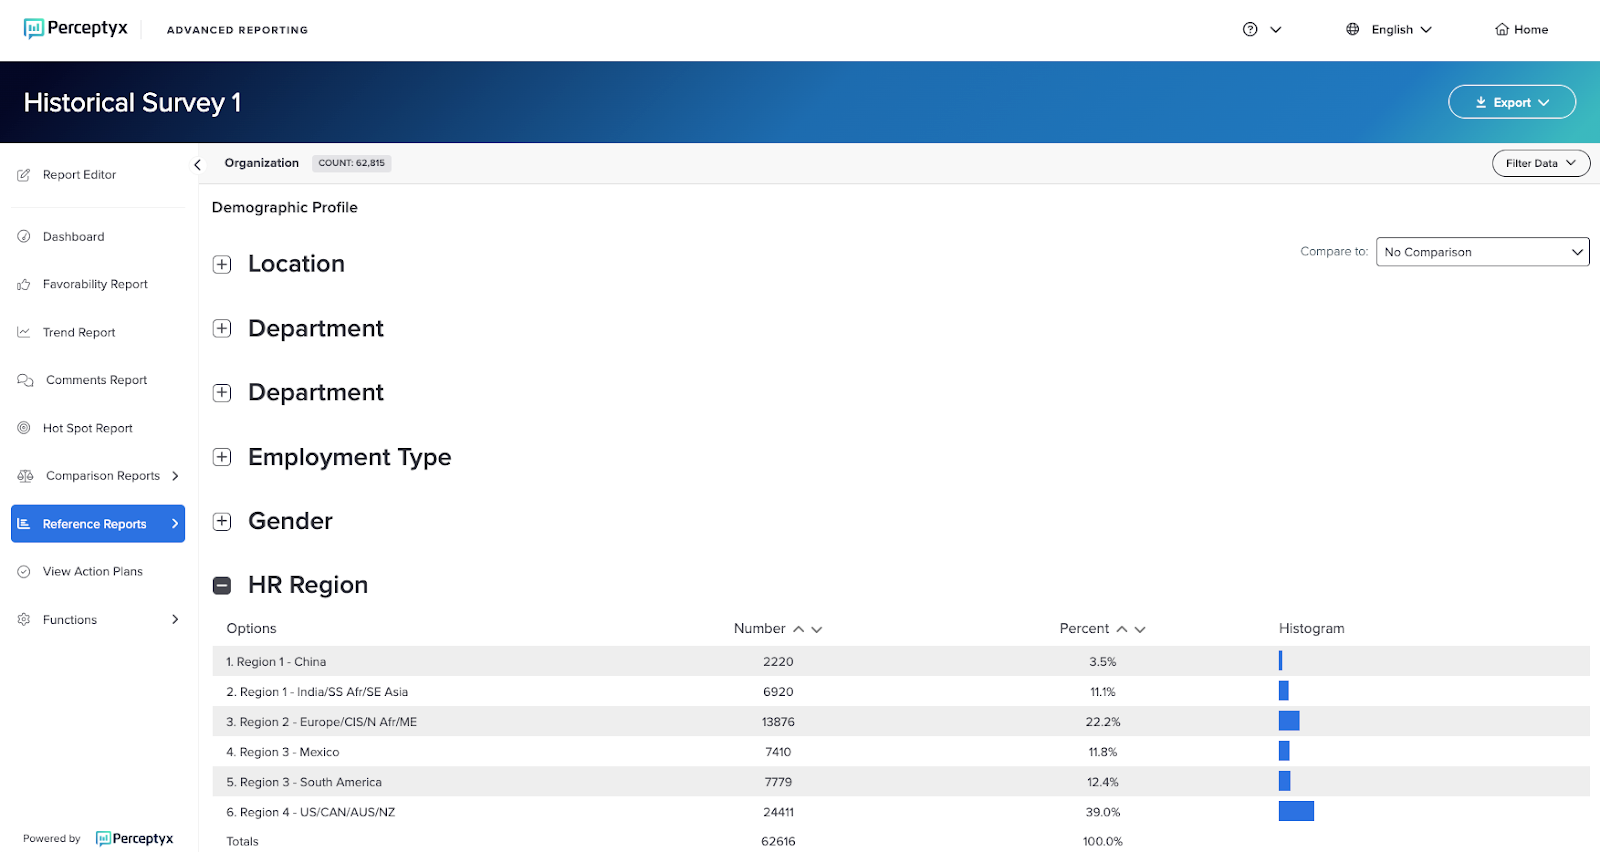
Demographic Profile Report
This report is available only if your survey contains demographics (via your data file or demographic questions on the survey).
The Demographic Profile report displays the percentage of respondents by all available demographic options.
Options – The demographic options that were supplied in the data file/survey.
Number – The number of participants who responded to the survey from each demographic group.
Percentage – The proportion of total respondents that came from each demographic group.
If you have configured trend to other surveys or have saved report filters, you can click the Compare To dropdown and select one of them. Comparisons display in parentheses beside each value in the report.

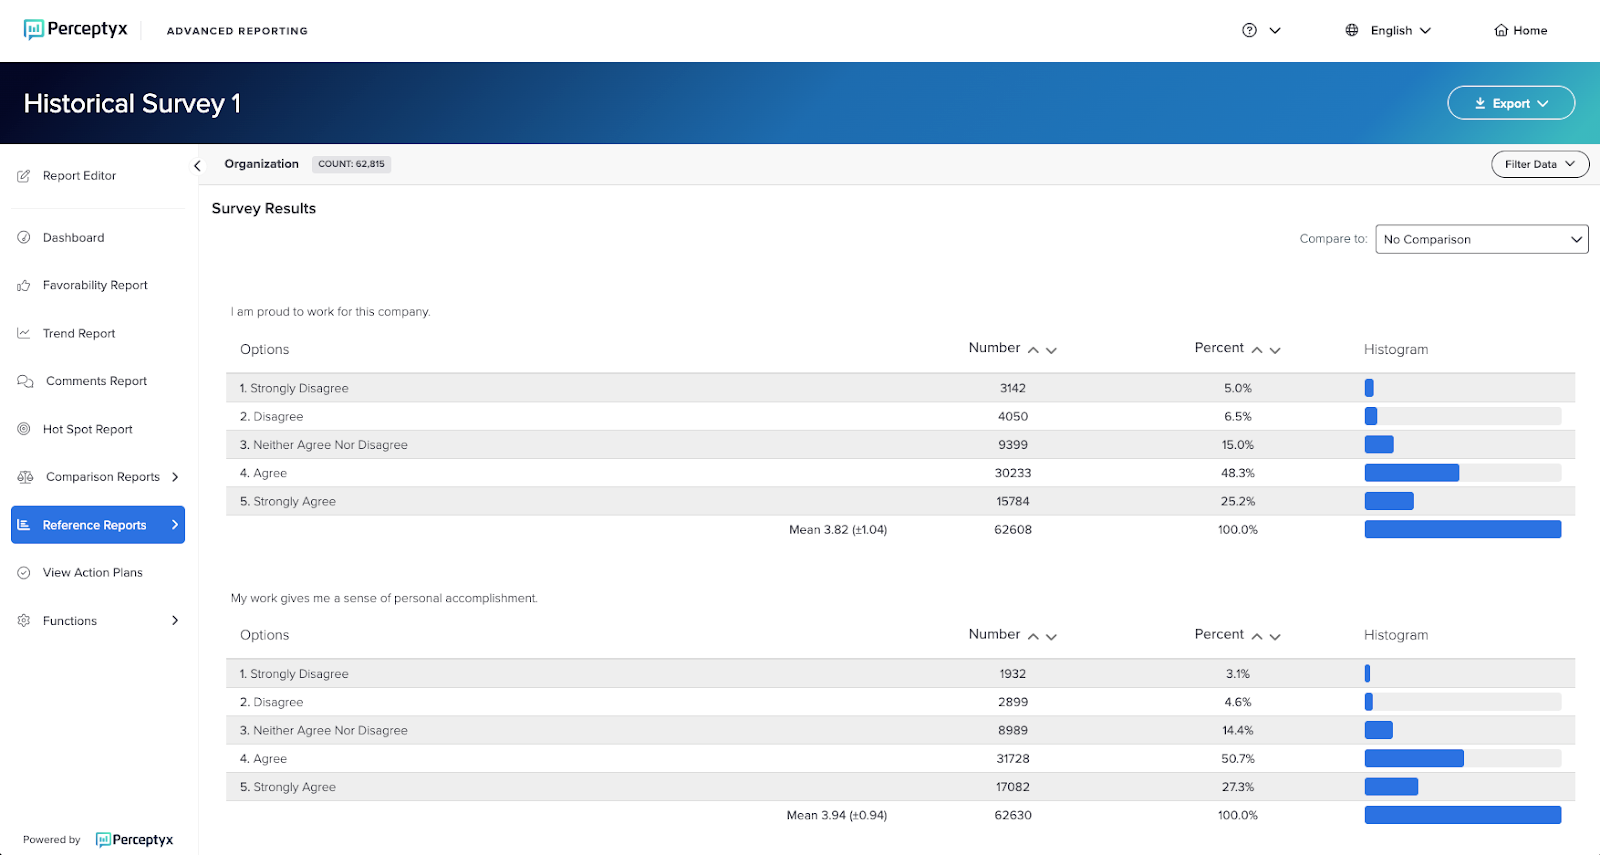
Survey Results Report
The Survey Results Report shows a view of all the response data totaled and displayed by question. If a comparison is available and selected, comparison data appears in parentheses.
By looking at the histograms for each question, you can quickly see the distribution of responses for each item on the survey.
Clicking on the histogram for any response option filters the report by that option and displays a demographic profile of the respondents that selected the response. If the minimum response threshold for responses has not been met for an option, the histogram will not be active.
To clear the filter, click Filter Data (top right), then select Clear Filter.

Export Option
You can export the NPS Report in PDF format and the Completion, Demographic Profile, and Survey Results Reports in Excel or PDF format.
Click Export (top right).
Select Export PDF or Export Excel.
Was this article helpful?
That’s Great!
Thank you for your feedback
Sorry! We couldn't be helpful
Thank you for your feedback
Feedback sent
We appreciate your effort and will try to fix the article