The Analyze page is your central location for accessing and working with reporting across the platform. It consolidates event-level reporting with cross-survey dashboards and third-party comment data, allowing you to move easily between different types of insights.
Depending on your role, you can:
View reports for events you have permission to access
Access/create cross-survey dashboards to compare results across events
Upload and analyze third-party comment data files
This article walks through the high level of the following topics and links out to step-by-step articles:
- Access the Analyze Page
- Analyze Page Overview
- Recent
- All Reports
- Access Third-Party Comments (Administrators Only)
- Access Cross-Survey Dashboards (Administrators/Creators Only)
To view an overview video:

Access the Analyze Page
You access the Analyze page directly from the navigation bar.
Log in to the Perceptyx Platform.
In the navigation bar, click Analyze.

Analyze Page Overview
The Analyze page has four main elements:
Recent
The Recent section provides quick access to your most recent event reports. Depending on your user role, it may also provide access to cross-survey dashboards and third-party comment data uploads. This access makes it easy to view the latest results.
All Reports
The All Reports section provides a complete, searchable list of all reporting items you have access to. Depending on your user role, the table can include listening events, cross-survey dashboards, and third-party comment data, along with key details to help you sort, filter, and locate specific reporting items.
+ Third-Party Comments (Administrators Only)
This option opens the Third-Party Comments tool, where you can upload comment data collected from sources outside of the Perceptyx platform and analyze them using Perceptyx’s proprietary AI models.
+ Cross-Survey Dashboard
This option allows you to create a new cross-survey dashboard, where you can compare results across multiple listening events.
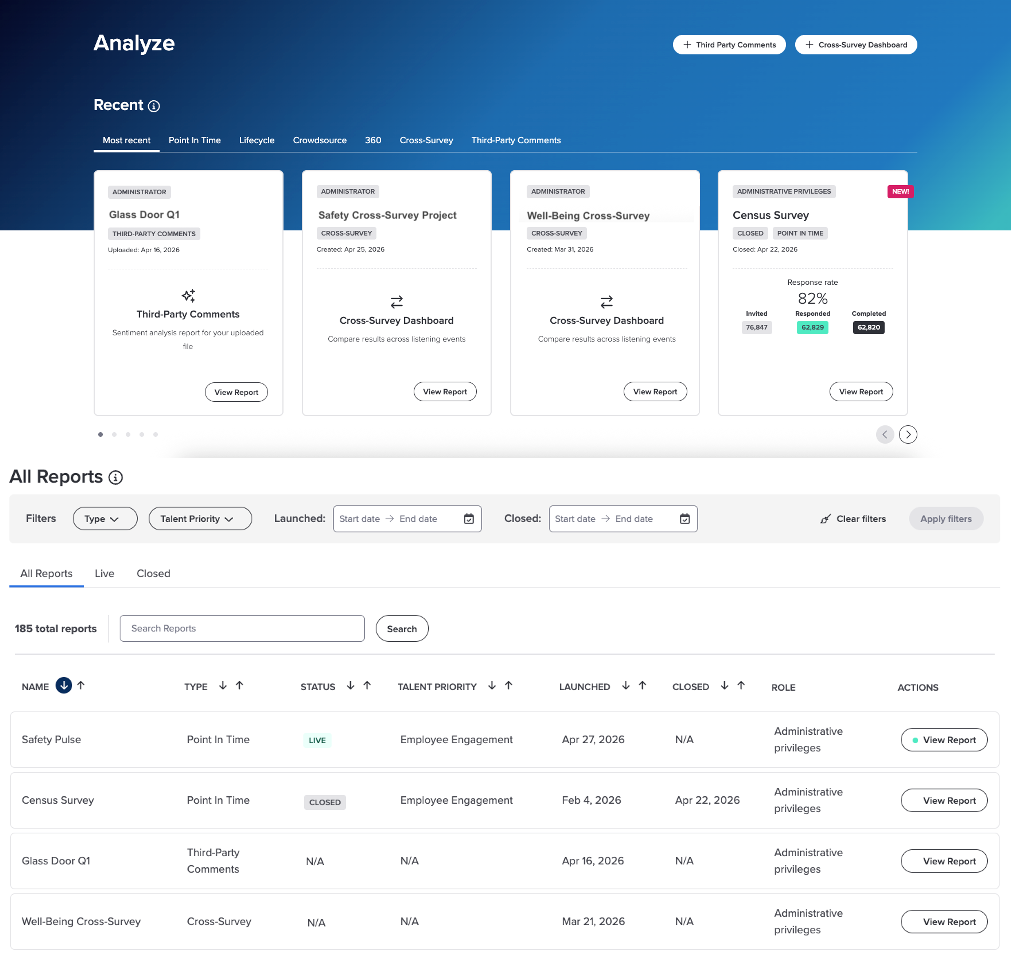

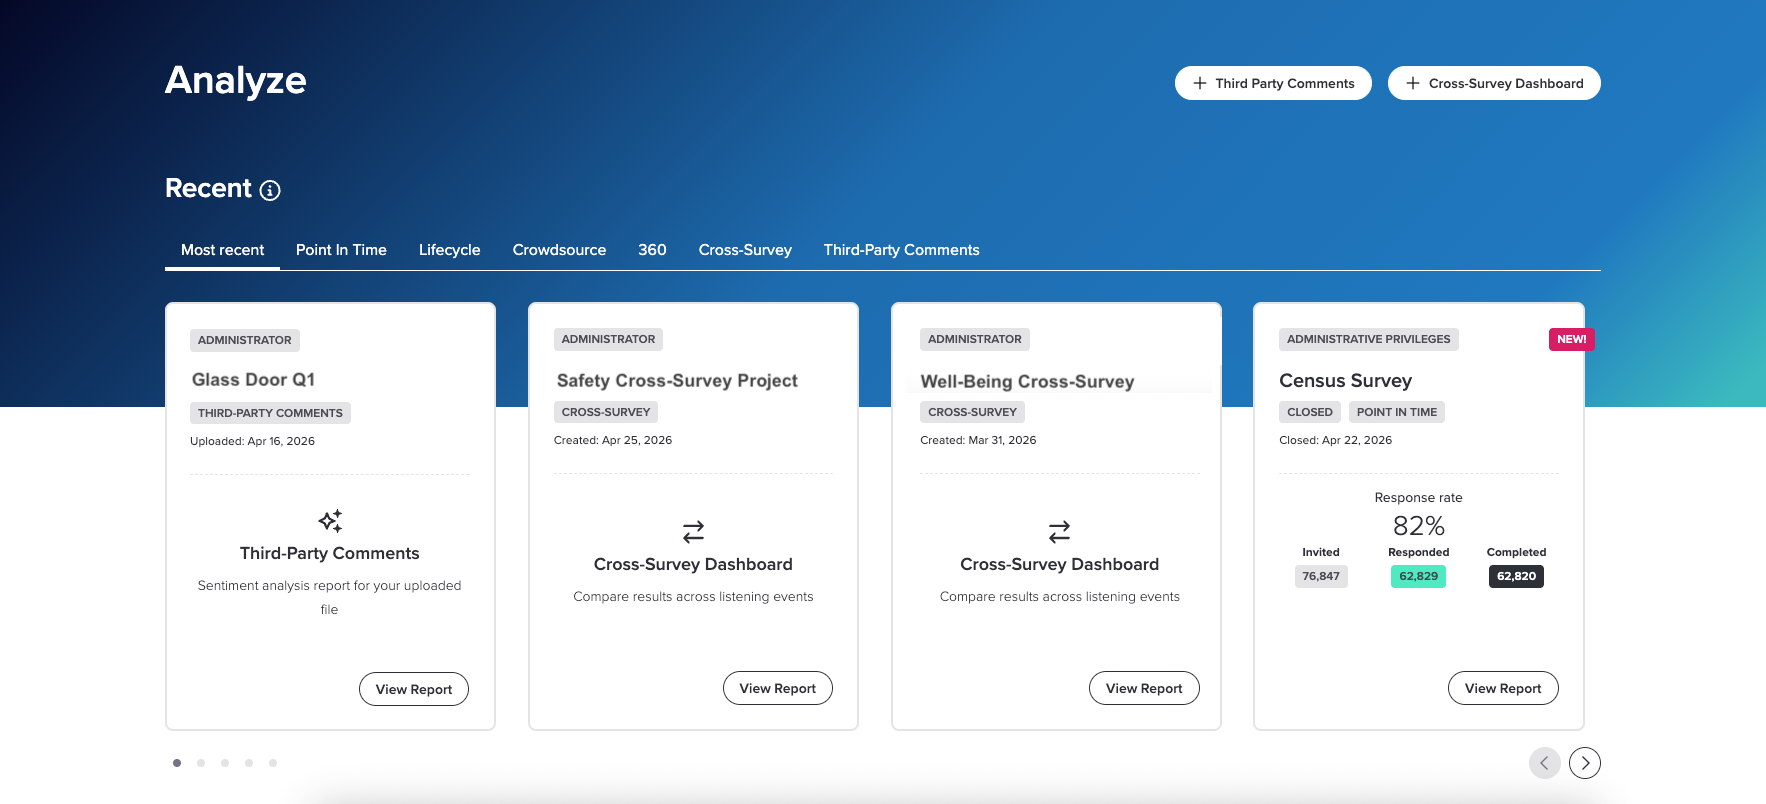
Recent
The Recent section displays cards with high-level information and quick access to the most recent reporting items you have permission to access.
Using the tabs above the cards, you can change the display to show:
The most recent items of all kinds (default)
Specific event types (Point-In-Time, Lifecycle, 360 Feedback, or Crowdsource)
Just cross-survey dashboards
Just third-party comments
Click View Report in a card to access the reporting item.

All Reports
The All Reports table provides a consolidated view of all available reporting items. The table columns display the following information:
Name: Event name, dashboard title, or file name
Type: Event type or Cross-Survey / Third-Party Data
Status: Event status (not applicable for dashboards or third-party data)
Talent Priority: Associated priority (events only)
Launched:
Event launch date
Dashboard creation date
File upload date
Closed: Event close date (if applicable)
Role: Your role (e.g., Manager or Administrator)
Actions: Click View Report to open event reporting, a cross-survey dashboard, or third-party comment data
Note: If an event is live, a green dot displays next to the View Report option.
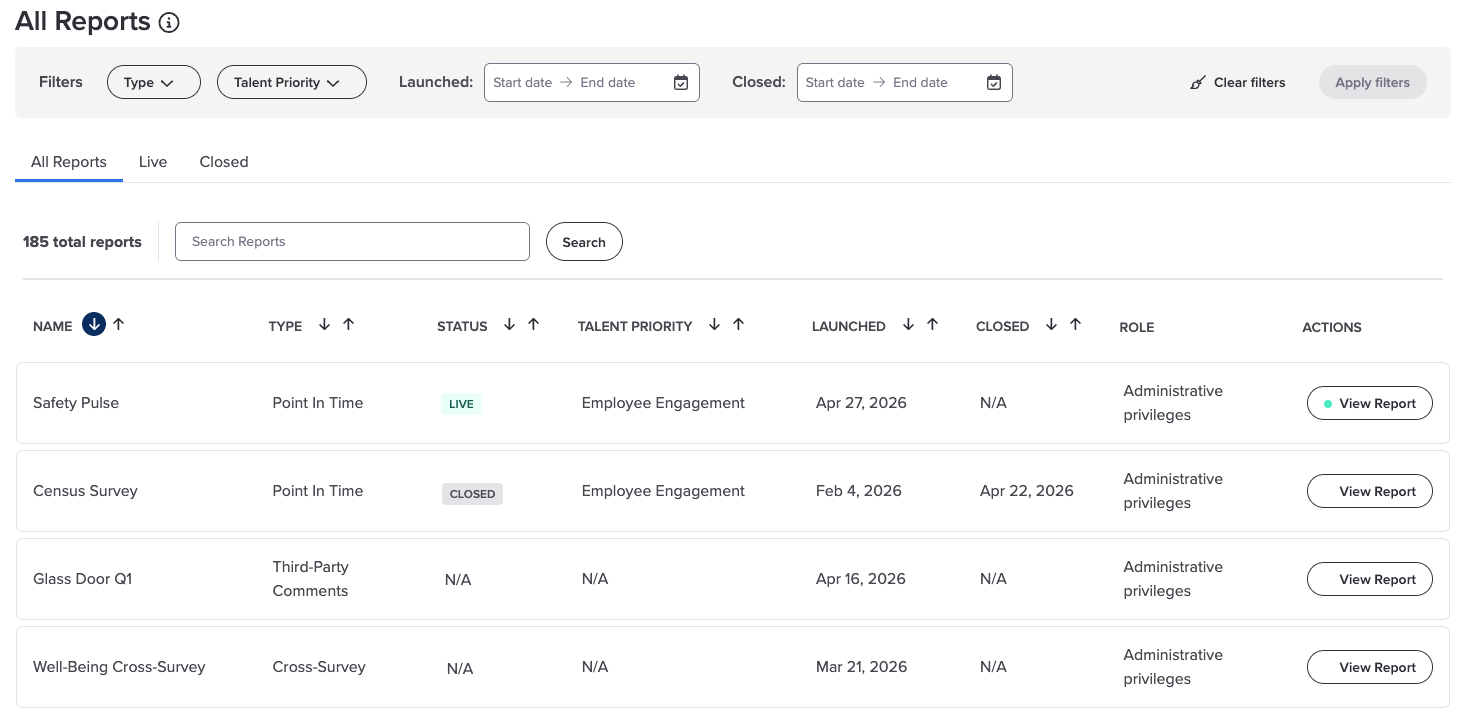
You can use the options above the table to:
Search for specific items
Sort by column
Filter by type, talent priority, launched date, or closed date
Clear filters

Access Third-Party Comments (Administrators Only)
The Third-Party Comments tool allows you to upload external comment data sets and analyze them using built-in text analysis capabilities.
Click + Third-Party Comments to access the Third-Party Comments workspace, where you can upload, manage, and analyze comment data files.
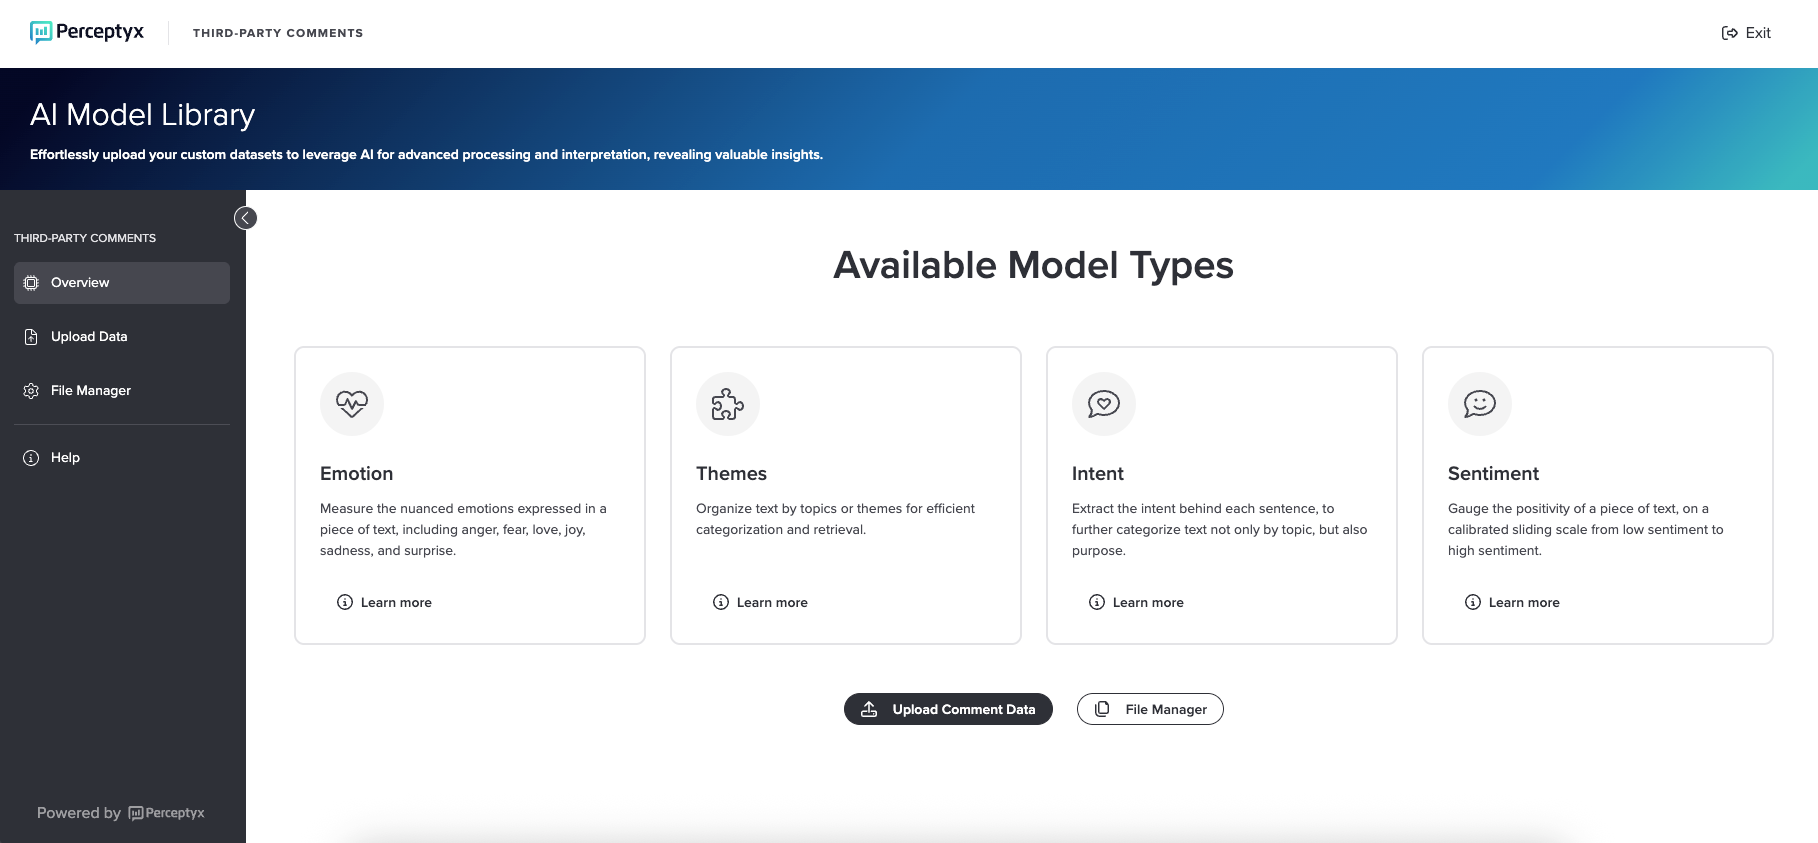
Uploaded files:
Appear in the Recent section of the Analyze page
Are included in the All Reports table on the Analyze page
Appear in the Third-Party Comment workspace when you click View Report
For step-by-step instructions on uploading and working with third-party comment data, see the Third-Party Comments article.

Access Cross-Survey Dashboards (Administrators/Creators Only)
Cross-survey dashboards allow you to compare results across multiple listening events in a single view.
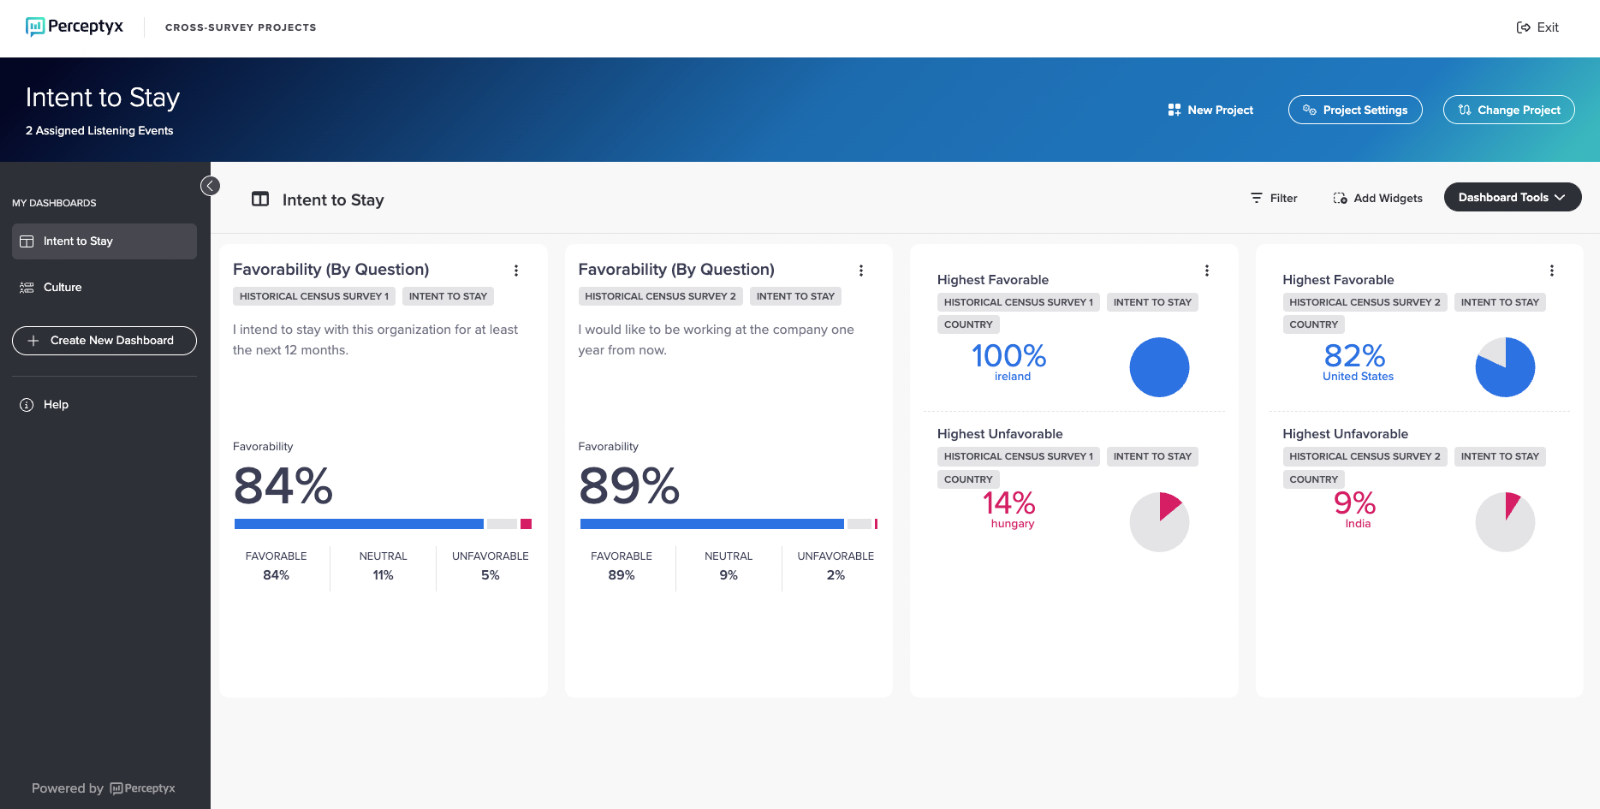
Click + Cross-Survey Dashboard to open the dashboard creation workflow.
Once created, dashboards:
Appear in the Recent section of the Analyze page
Are included in the All Reports table on the Analyze page
Open directly when you click View Report
For step-by-step instructions on creating cross-survey dashboards, see the Cross-Survey Dashboards and Build Cross-Survey Dashboards articles.

Overview Video
Was this article helpful?
That’s Great!
Thank you for your feedback
Sorry! We couldn't be helpful
Thank you for your feedback
Feedback sent
We appreciate your effort and will try to fix the article