Listen
The Settings phase decides how your results show up once people start responding. It is where you protect people's confidentiality with minimum response numbers and choose what your reports show.
This article covers Point-In-Time and Lifecycle events. Settings comes after the Communications phase, or right after Invite if your event does not send emails through Perceptyx. Nothing here changes what participants see in the survey itself. Everything on this page is about reporting.
This article walks through
Open the Settings Phase
If you are already in the Event Builder, click Settings in the left panel.
If you are starting from somewhere else:
- Go to the Listen page and find your event.
- Click Manage Event. The Event Builder opens.
- Click Settings in the left panel.
Configure Standard Settings
The Settings page has two sections:
- Standard Settings cover the basics for your whole event, like minimum response numbers and whether action planning is turned on.
- Advanced Settings fine-tune what individual reports show in Advanced Reporting, like hiding a tab or adding a column.

Here is what each standard setting does when it is turned on.
| Setting | What it does when on |
|---|---|
| Minimum # Responses For Survey Results | Results stay hidden until at least this many people have responded in a given view or filter. This protects people's confidentiality in small groups. |
| Minimum # Responses For Comment Results | A comment question only shows up in comment reporting once it has at least this many comments in the current view or filter. For example, set it to 10 and a question with 8 comments in someone's view stays hidden for them. |
| Minimum # Responses For Demographic Filter | A demographic group only shows up as a filter option once it has at least this many responses. This stops people from filtering down to a group so small that individuals could be identified. |
| Disable Driver Analysis For Favorability Report | Turns off driver analysis in the Favorability Report, so people cannot see which questions or categories are most closely linked to a result. |
| Include the Overall Score | Shows the overall average score at the bottom of your reports. |
| Percent Favorable Results Displayed as a Whole Number | Rounds every percentage in your reports to a whole number, so you see 72% instead of 71.8%. |
| Enable Action Planning | Lets people build action plans from this event's results. This is on by default for new self-led events. |
| Exclude Partial Survey Responses | Only counts responses from people who clicked Submit. Anyone who started the survey but did not finish is left out of reporting. This setting only shows up for events where each person gets their own unique link. |
| Use the New Reporting Look-and-Feel | Shows your reports in the current reporting design, with your company branding if you have set it up. This is on by default for new events. |
Note
If your company has set a minimum response number for all of its events, you can raise it for this event but you cannot go below it.
Heads up
Comment Copilot only works on events using the new reporting look-and-feel. If your organization uses Comment Copilot, leave Use the New Reporting Look-and-Feel turned on.
Change your standard settings
- Click a setting's toggle to turn it on or off. To turn every standard setting on at once, use the Enable All Standard Settings toggle at the top of the section.
- To change one of the minimum response numbers, type a new number in the Value box for that setting.
Configure Advanced Settings
Advanced settings let you adjust individual reports in Advanced Reporting. They are grouped into three sections: Favorability Report, Benchmark Report, and Demographic Crosstab. Everything starts turned off except Display respondent counts in the Favorability Report.
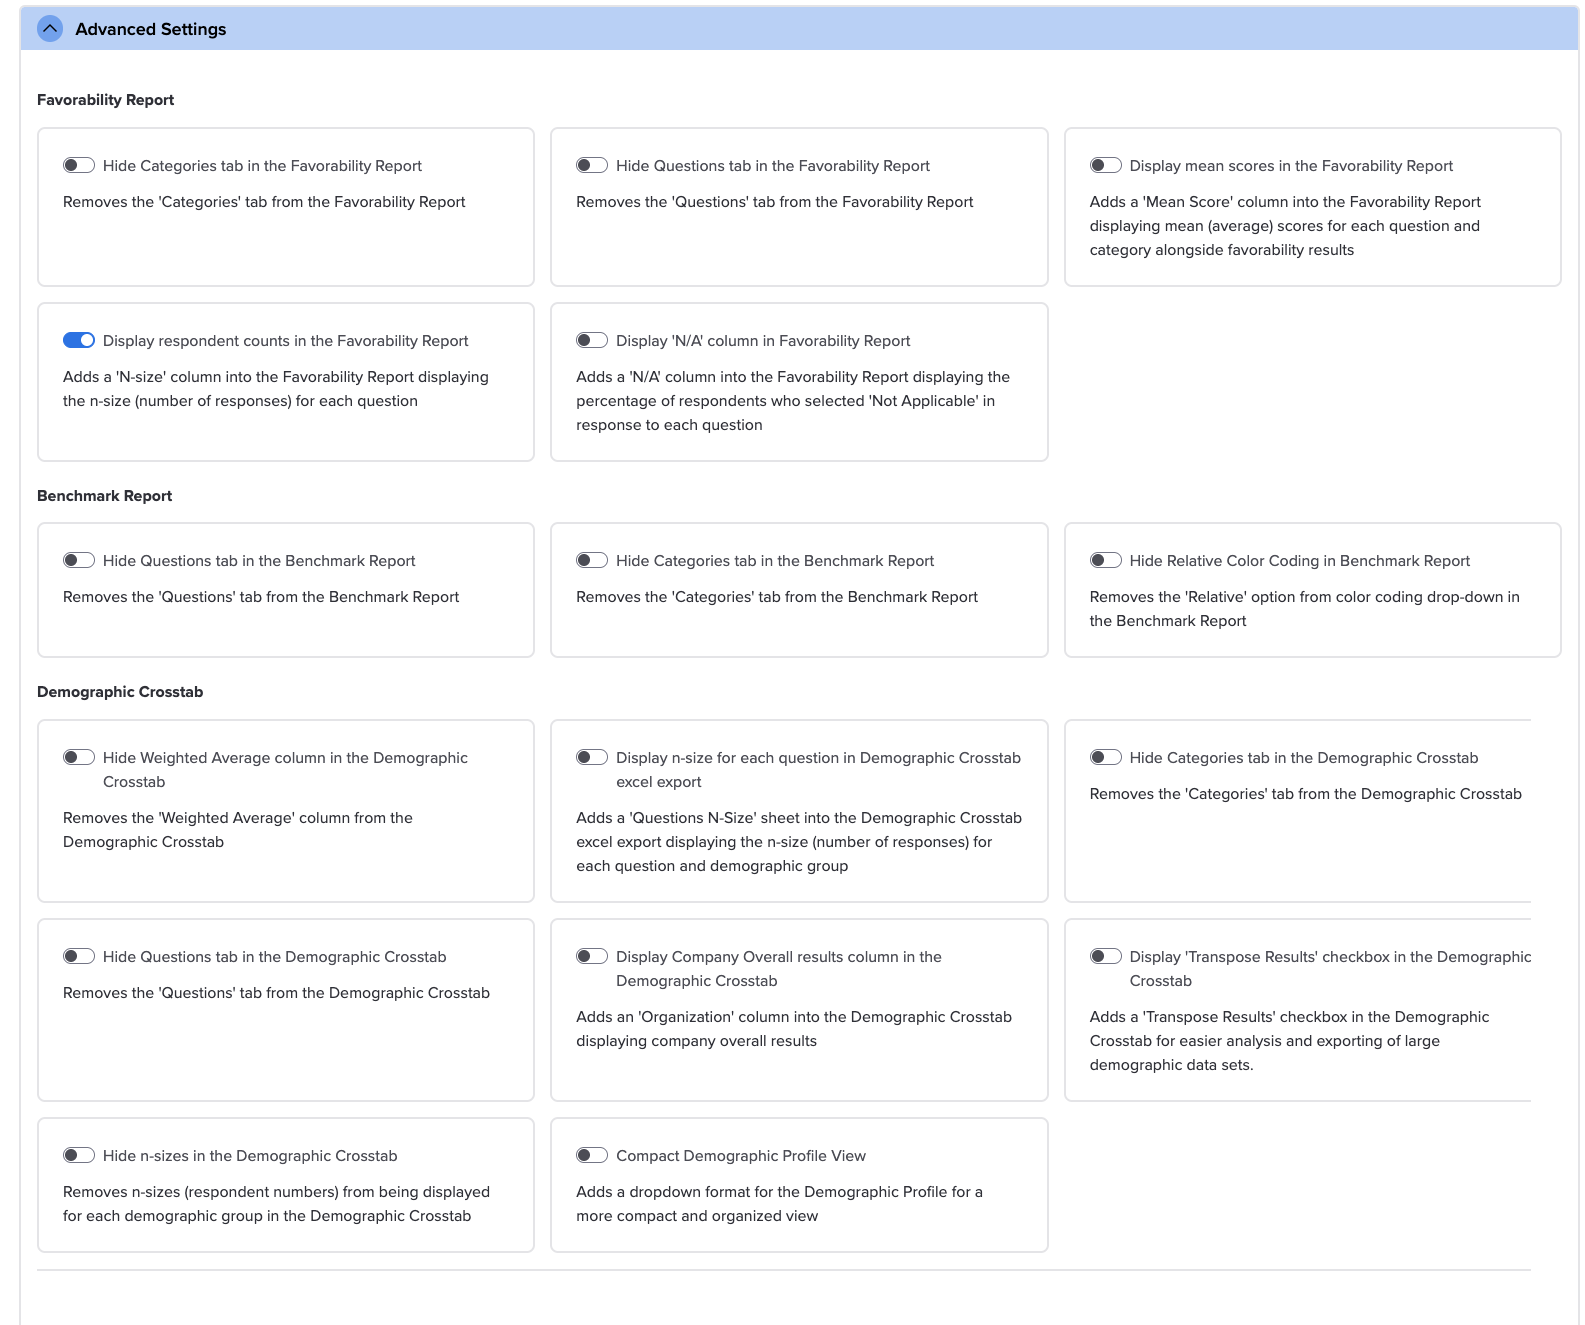
Here is what each advanced setting does when it is turned on.
Favorability Report
| Setting | What it does when on |
|---|---|
| Hide Categories tab in the Favorability Report | Removes the Categories tab from the report. |
| Hide Questions tab in the Favorability Report | Removes the Questions tab from the report. |
| Display mean scores in the Favorability Report | Adds a Mean Score column showing the average score for each question and category, next to the favorability results. |
| Display respondent counts in the Favorability Report | Adds an N-size column showing how many people answered each question. This one is on by default. |
| Display 'N/A' column in Favorability Report | Adds an N/A column showing the percentage of people who picked Not Applicable for each question. |
Benchmark Report
| Setting | What it does when on |
|---|---|
| Hide Questions tab in the Benchmark Report | Removes the Questions tab from the report. |
| Hide Categories tab in the Benchmark Report | Removes the Categories tab from the report. |
| Hide Relative Color Coding in Benchmark Report | Removes the Relative option from the color coding menu in the report. |
Demographic Crosstab
| Setting | What it does when on |
|---|---|
| Hide Weighted Average column in the Demographic Crosstab | Removes the Weighted Average column. |
| Display n-size for each question in Demographic Crosstab excel export | Adds a Questions N-Size sheet to the Excel export, showing how many people answered each question in each demographic group. |
| Hide Categories tab in the Demographic Crosstab | Removes the Categories tab. |
| Hide Questions tab in the Demographic Crosstab | Removes the Questions tab. |
| Display Company Overall results column in the Demographic Crosstab | Adds an Organization column showing your company's overall results, so you can compare each group against it. |
| Display 'Transpose Results' checkbox in the Demographic Crosstab | Adds a Transpose Results checkbox that flips rows and columns, which makes big demographic data sets easier to read and export. |
| Hide n-sizes in the Demographic Crosstab | Stops the number of people in each demographic group from showing. |
| Compact Demographic Profile View | Shows the Demographic Profile as a dropdown for a more compact, organized view. It sits in this group, but it changes the Demographic Profile rather than the crosstab. |
Change your advanced settings
- Scroll down to Advanced Settings. If the section is collapsed, click the arrow next to its name to open it.
- Turn on the toggle for each setting you want.
When everything looks right, click Next: Launch.
What's next
Your settings are in place. The last step is going live. Launch Your Listening Event | Point-In-Time & Lifecycle walks you through scheduling your emails and turning your event on.
Was this article helpful?
That’s Great!
Thank you for your feedback
Sorry! We couldn't be helpful
Thank you for your feedback
Feedback sent
We appreciate your effort and will try to fix the article