Develop
Once people start working through your course, you will want to know two things: how well they understood it, and what to do about the parts they did not. Course Analytics answers both.
Every Develop course comes with its own analytics. They are split across two pages. The Overview Dashboard gives you the numbers: comprehension scores, a heatmap that shows who understood what, and how your nudges are landing. Detailed Reports gives you the story behind the numbers: AI-written insights about where the group is strong, where it is stuck, and what you might do next, plus a full report for each person.
You do not need to be a data person to use either one. This article walks through each part of both pages and what it is actually telling you.
This article walks through
Where to find course analytics
- Go to the Develop page and click Manage Course on the course you want to look at.
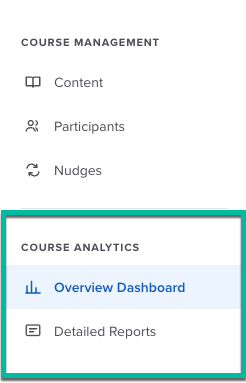
- In the left panel, find the Course Analytics section, just under Course Management.
- Click Overview Dashboard for the numbers, or Detailed Reports for the AI insights.
Analytics are available to the people who manage the course. Learners do not see any of this.
Before anything shows up
Scores come from finished learning conversations. Until at least one participant has completed a module, there is nothing to score yet, so the charts will show an empty state instead of zeros. Give it a little time after you invite people.
The Overview Dashboard
The Overview Dashboard is your quick read on the whole course. It has three parts, from top to bottom: the comprehension card, the comprehension heatmap, and two smaller cards for nudges and conversational turns.
Comprehension score and distribution
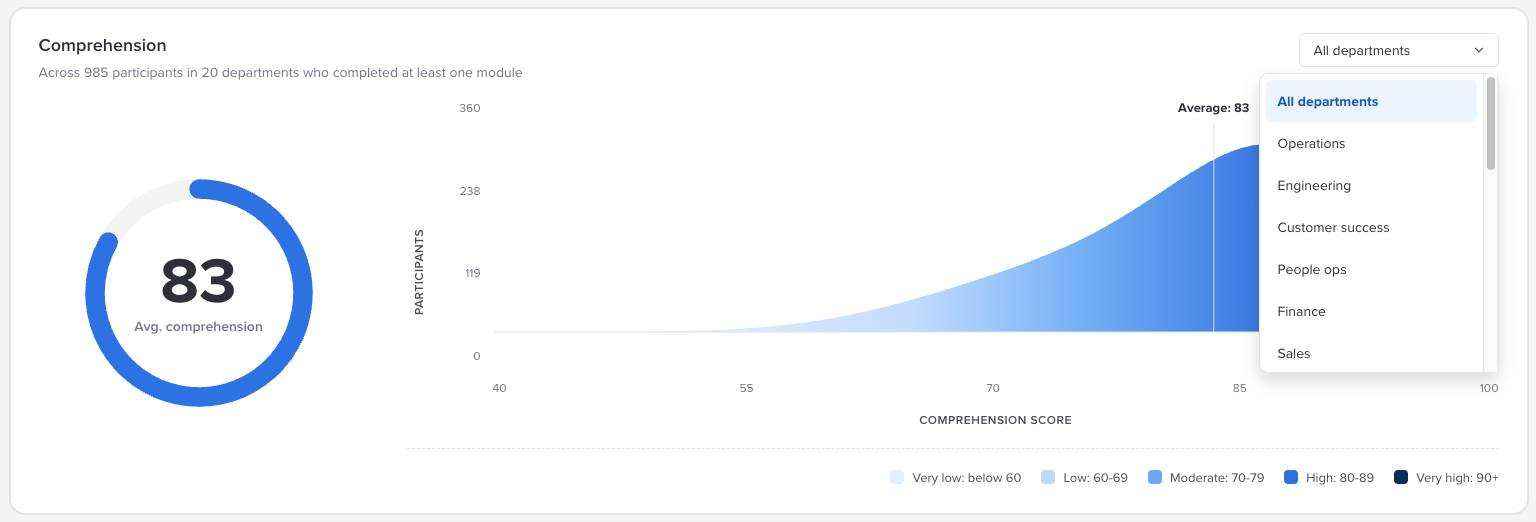
The top card shows your course's average comprehension score as a big number in a ring, out of 100. Next to it is a curve showing how scores are spread across everyone, with a line marking the average. The line under the card title tells you how many participants and departments are included. Only people who have completed at least one module are counted.
The average is useful, but the curve is where you learn more. A tall, narrow peak means most people landed in roughly the same place. A long tail off to the left means a group of people struggled, even if the average looks healthy.
Scores fall into five bands, and the same bands are used throughout the dashboard:
| Band | Score |
|---|---|
| Very low | Below 60 |
| Low | 60 to 69 |
| Moderate | 70 to 79 |
| High | 80 to 89 |
| Very high | 90 and above |
Use the All departments dropdown in the top right corner of the card to look at a single department. The score and the curve both update to match.
What the score measures
Comprehension is scored against the learning objectives in each module, based on what the learner actually said during the conversation. It is not a quiz score and it does not reward polished writing. It reflects whether the person showed they understood the objective.
The comprehension heatmap
The heatmap is the most detailed view on the page. It is a grid that shows comprehension broken down by part of the course and by person (or department), with color doing most of the talking.
- Rows start with Course Overall, followed by each module. Expand a module to see a row for each of its learning objectives.
- Columns start with the Average, followed by one column for each person or department you are looking at.
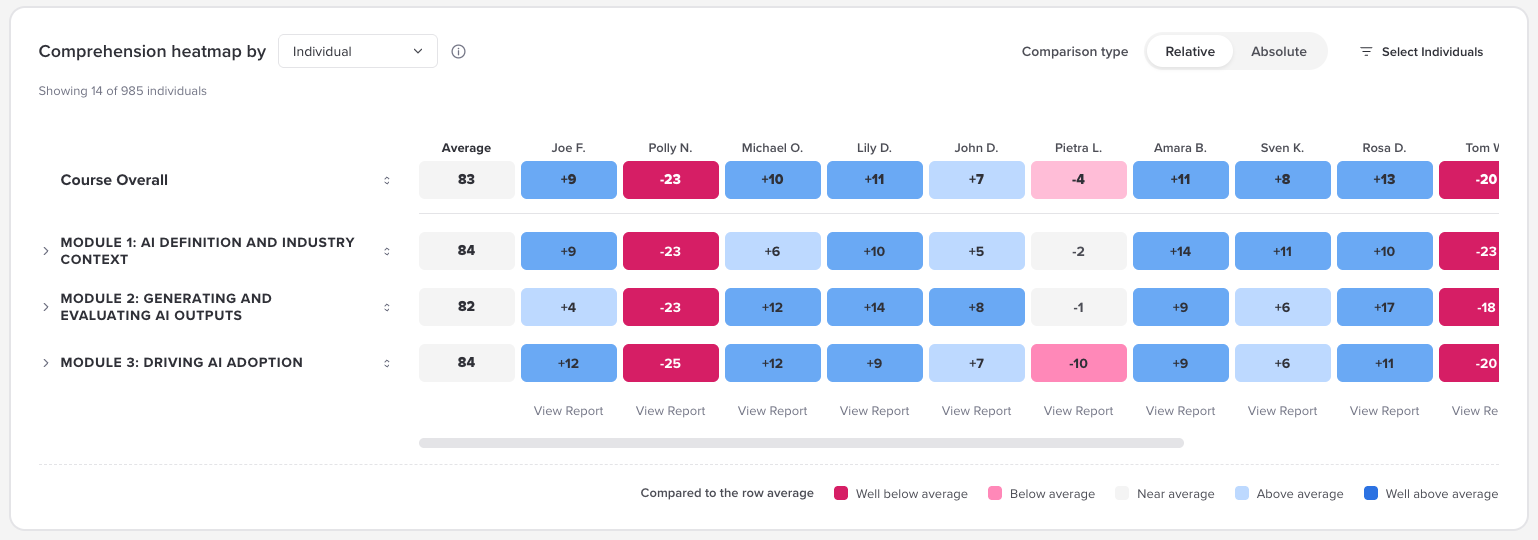
Group by individual or department. The Comprehension heatmap by dropdown switches the columns between Individual (one column per participant) and Department (one column per department, with everyone in that department rolled together).
Pick relative or absolute. The Comparison type toggle changes what the colors and numbers mean:
| Comparison type | What each cell shows | Good for |
|---|---|---|
| Relative | How far above or below the average for that row, like +9 or -23. Colors run from well below average to well above average. | Spotting who is ahead of or behind the group on a specific module or objective. |
| Absolute | The actual comprehension score, like 92 or 60. Colors use the five score bands from the card above. | Seeing whether people actually reached a solid level, regardless of how everyone else did. |
It is worth flipping between the two. Someone can be below average in Relative mode and still score in the High band in Absolute mode, which usually just means the whole group did well.
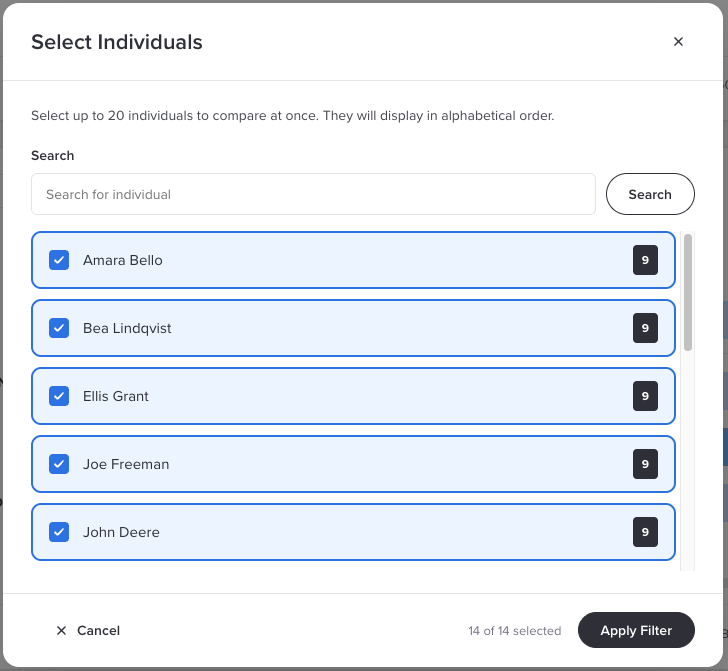
Choose who to show. Click Select Individuals to search for and pick up to 20 people to compare at once. They display in alphabetical order. If you have not picked anyone, the heatmap starts with people who already have scores. In Department mode the button becomes Select Departments and works the same way.
Sort it. Use the sort controls on a row to reorder people by their score on that row, or on a column to reorder the rows by that person's scores. Sorting a module row is a fast way to find who needs help with that module.
Open someone's report. In Individual mode, each column has a View Report link at the bottom. It takes you to that person's report in Detailed Reports. In Department mode, that bottom row shows the number of participants in each department instead.
Empty cells. A cell showing -- means that person has not completed that module yet. Everyone enrolled appears in the heatmap, including people who have not started, so you can always find them.
Small departments
Department columns do not hide small groups. If a department has one participant, that column is really just that one person's scores under the department name. Keep that in mind before sharing a department view more widely.
Reinforcement nudges and conversational turns
The two cards at the bottom of the dashboard show what happens around the learning itself.
Reinforcement nudges shows how your follow-up nudges are doing. View rate (by individual) is the share of people who opened at least one nudge, and Total nudges delivered counts every nudge sent so far. Click (view) to jump to the Nudges screen for the course. Click the info icon next to the view rate to see how your number compares:
| View rate | What it suggests |
|---|---|
| Below 10% | Low. This may point to a technical issue with delivery. |
| 10% to 40% | Developing. People may need some encouragement to engage. |
| 40% to 80% | Strong. This is within the expected range. |
| Above 80% | Exceptional nudge engagement. |
Number of conversational turns shows the average number of back-and-forth exchanges each participant had in their learning conversations. There is no magic number here. It is mostly useful for spotting changes, like a module that suddenly takes far more turns than the others, which can mean people are working harder to get there.

Nudges need Activate
Nudges are only available if your organization has Activate. Without it, the nudges card will not have anything to show. To set them up, see Setting Up Nudges for Your Course.
Detailed Reports
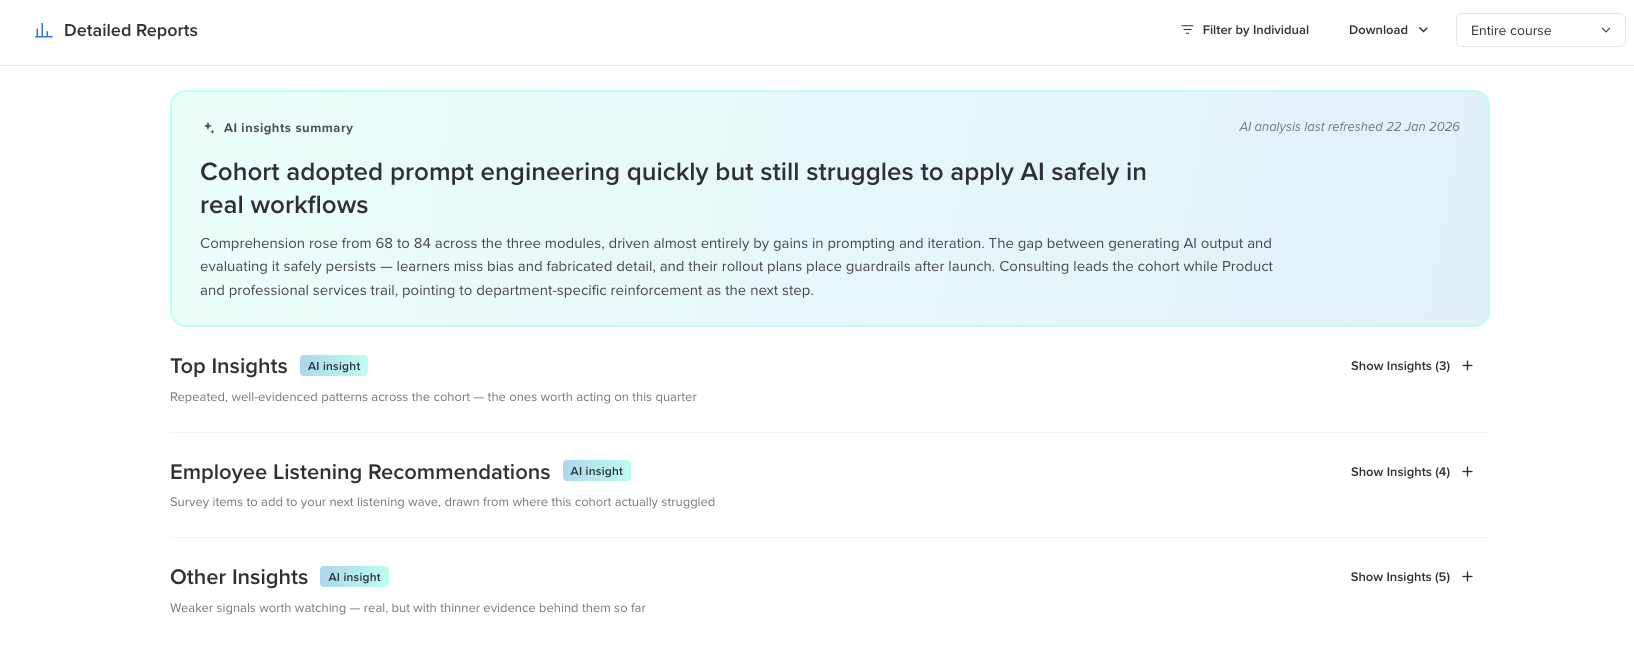
Where the Overview Dashboard tells you what happened, Detailed Reports tells you why. Develop reads through the learning conversations and writes up patterns it found across the group, with the evidence behind each one.
At the top is the AI insights summary: a headline and a short paragraph that sum up how the course went overall. The date in the corner tells you when the analysis was last refreshed.
Below the summary, insights are organized into three sections. Click Show Insights to open a section, and View Details on an insight to see the evidence behind it.
| Section | What is in it |
|---|---|
| Top Insights | The strongest, most consistent patterns across the group. Open by default, and the place to start. |
| Employee Listening Recommendations | Suggested survey items for your next listening event, based on where this group actually struggled. Handy if you also run listening events in Perceptyx. |
| Other Insights | Weaker signals worth keeping an eye on. They are real, but there is less evidence behind them so far. |
Each insight is labeled with a category, like Knowledge gap, Strength, or Patterns, and carries a confidence level that reflects how much evidence supports it. Many include a representative quote from the conversations, so you can see what people actually said.
Use the Entire course dropdown in the top right corner to narrow the insights to a single module.
Read insights as a starting point
The insights are generated by AI, and AI can make mistakes. They are a solid first read on what is happening in your course, not a final verdict. Check the evidence and quotes before acting on something important.
Individual reports
To look at one person, click Filter by Individual and choose them from the list, or click View Report under their column in the heatmap. Their name appears as a filter chip at the top of the page. Click the x on the chip, or Clear Filters, to go back to the whole group.
An individual report includes:
- Course overall comprehension, with the group average beside it for context.
- Number of conversational turns across the course.
- Comprehension score by module, so you can see where they were strongest and where they dropped off.
- An AI insights summary written about that person.
- Knowledge gaps, Concerns, Strengths, and Behavioral patterns, each with supporting quotes.
- Demonstrated competencies, showing each skill the person showed in the conversation and a skill level of Foundational, Intermediate, or Advanced.
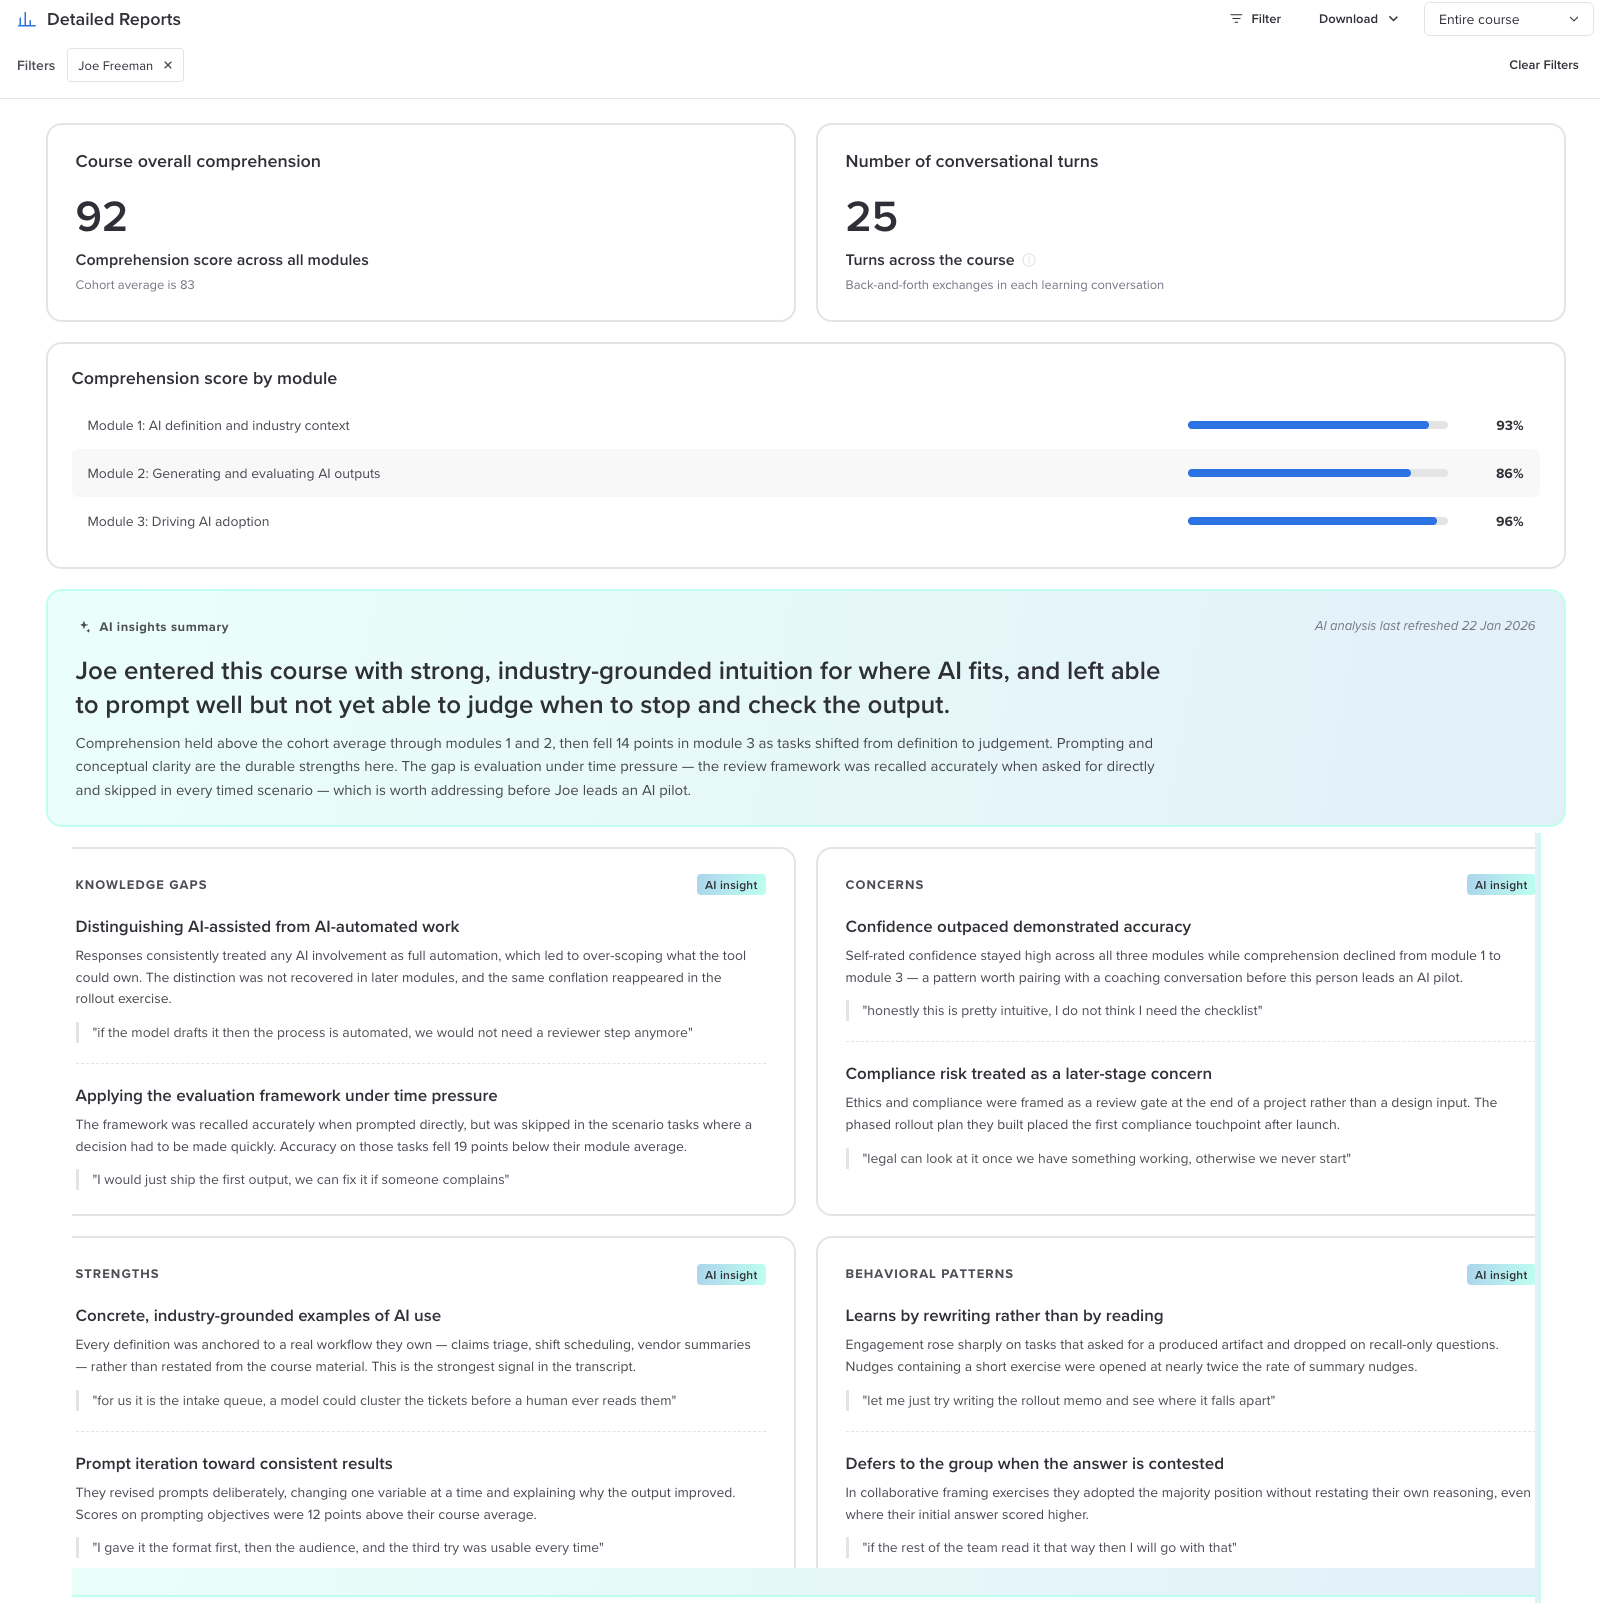
Individual reports are written to be useful in a coaching conversation. A pattern like confidence running ahead of accuracy is a good thing to talk through with someone before they lead related work.
Downloading your data
On Detailed Reports, the Download menu gives you two options:
- Download CSV exports the data as a spreadsheet you can work with outside Develop.
- Download Individual Transcript gives you a participant's full learning conversation, so you can read exactly what was said.
The Overview Dashboard also has a Download CSV button in its top right corner.
Using your analytics well
- Start with the curve, then the heatmap. The curve tells you whether there is a problem. The heatmap tells you where it is and who it affects.
- Look for rows, not just people. If a whole module row is low, the issue is probably the module, not the learners. That is a cue to look at your source material for that module.
- Pair the numbers with the insights. A low score on a module plus a Top Insight about the same topic is a strong signal worth acting on.
- Feed it into listening. The Employee Listening Recommendations are an easy way to check whether a gap is about knowledge or about something in the work environment.
For development only
This data is for training and development purposes. It should not be used to make employment decisions. Some of it is generated by AI, which can make mistakes.
Common questions
Why does someone show -- in every cell?
They are enrolled but have not completed a module yet, so there is nothing to score. Their cells will fill in as they finish modules. Averages only count real scores, so empty cells do not drag anyone down.
I cannot find someone in Select Individuals.
Try searching by their name. Everyone enrolled in the course is listed, even if they have not started. If they still do not show up, check that they have been added on the Participants screen.
Why can I only compare 20 people at once?
Twenty columns is about as much as the heatmap can show while still being readable. To look at more people, switch to Department view or change your selection.
Why does a department column look exactly like one person's scores?
That department has one participant. Department columns are not hidden or combined when they are small.
Why is the nudges card empty?
Either nudges are turned off for this course, nobody has finished the course yet, or your organization does not have Activate.
Was this article helpful?
That’s Great!
Thank you for your feedback
Sorry! We couldn't be helpful
Thank you for your feedback
Feedback sent
We appreciate your effort and will try to fix the article