The Hot Spot Report allows you to see differences in scores across demographics for each survey question and category. As the name implies, you can also filter for hot spots. In the example shown below, "Only Show Hot Spots" is filtered for hot spots as defined by those Countries whose employees responded -10 percentage points on the Engagement Index than all Countries’ employees as a whole. The result is that Singapore, in this example, shows lower engagement than others.
Note:
- The Hot Spot report will reflect your current view or filter that is applied.
- Any group that does not meeting the minimum threshold of responses will not be shown.
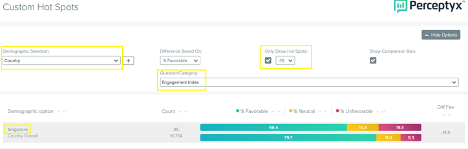
Demographic Selection
- You can make multiple Demographic Selections, and they can be selected within the first dropdown. This will result in separate lines being shown for each.
- You can also make a second Demographic Selection by clicking the plus sign to right of the Demographic Selection dropdown.
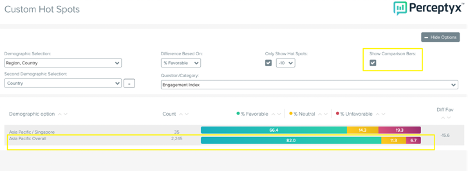
- Once you make a second Demographic Selection, each line in the report will display both selections like in the example below.

Comparison Bar
- A comparison bar can be added to the report by checking the box found under Show Comparison Bars. This will insert a secondary line directly under each demographic option line to show an Overall comparison to the first demographic selection.
- When selecting more than one demographic in the first selection dropdown, the comparison will be shown for each.
Was this article helpful?
That’s Great!
Thank you for your feedback
Sorry! We couldn't be helpful
Thank you for your feedback
Feedback sent
We appreciate your effort and will try to fix the article