Within the Comparison Reports area, there are two types of comparison reports available: Demographic Crosstab Report and the Benchmark Report. Both reports help you to compare your results to results from other respondent groups - either specific demographic segments of your survey population or benchmark populations inside or outside your organization.
Note: This article reflects the default configuration for the Demographic Crosstab and Benchmark Reports. If an administrator changes the default report configurations for your listening event, you might not see all the features described here.
This article walks through:

Demographic Crosstab Report
This report is available only if your survey includes demographics and Favorability Type questions.
The Demographic Crosstab report enables you to break out results for questions or categories by demographic and compare results for demographic groups side by side.
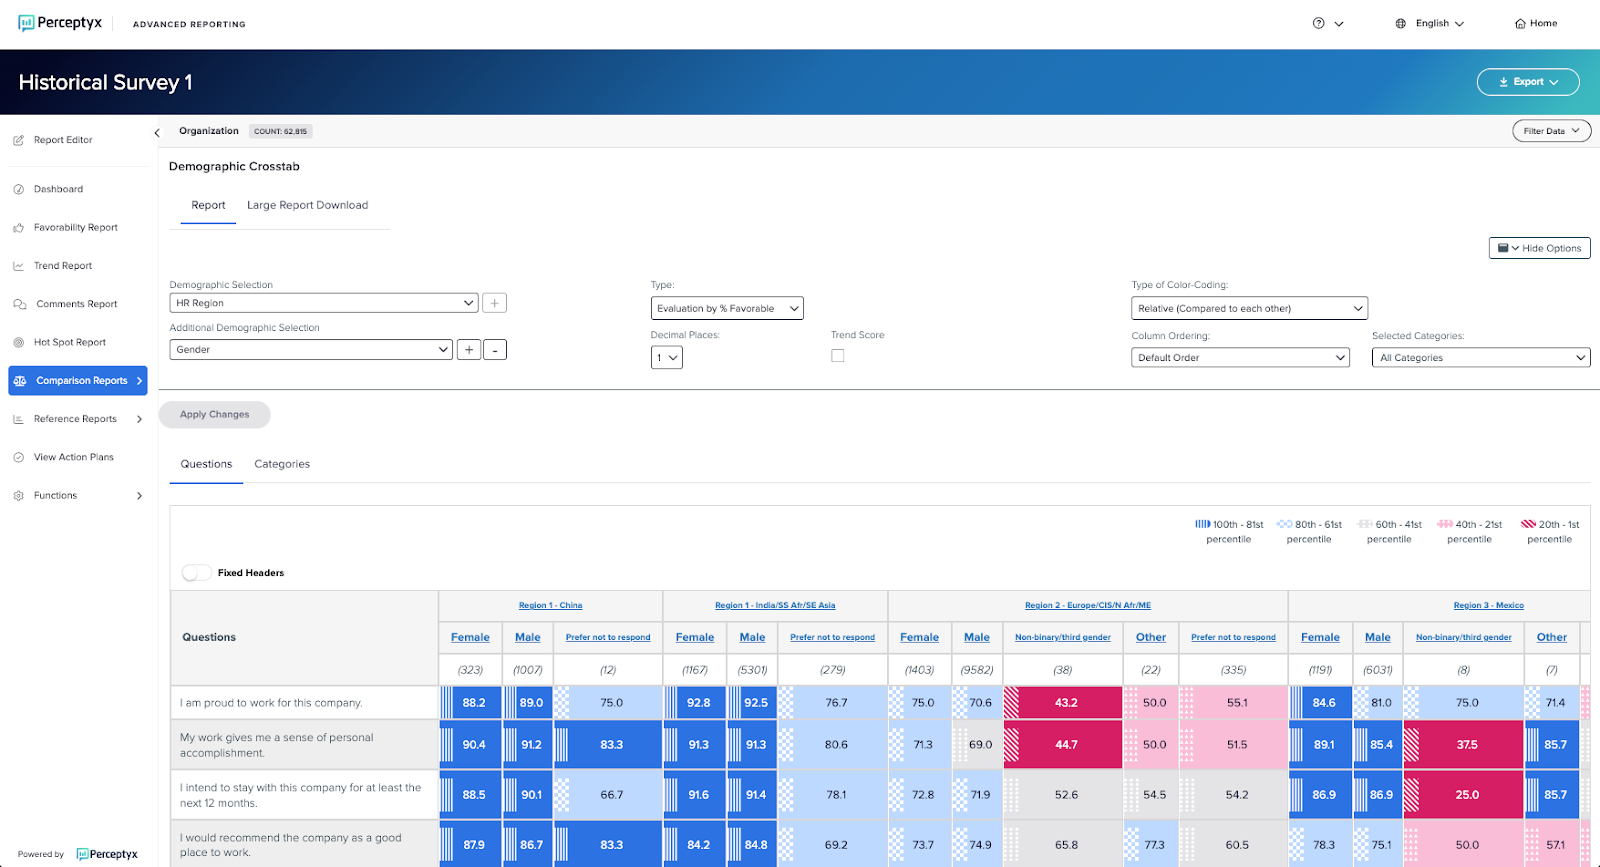
The top section of the report contains the following options:
The body of the report shows the results in a table format. Click the Questions tab to see results for every question; click the Categories tab to see results for each category.
The following example shows an evaluation by % Favorable for all questions, broken out for two demographics – HR region and gender.
The following example shows the same options for categories.

Note: The Demographic Crosstab Report uses exclusion rule filtering to prevent users from identifying scores for groups below the minimum threshold by requiring the remainder of the filter to also meet the minimum threshold. For more details, see the Exclusion Rule Filtering article.
The Large Report Download tab provides download access for crosstab reports that exceed 250 columns. Reports that exceed 250 columns are automatically created as a report export and displayed in the Large Report Download tab. If you request a report that exceeds 250 columns, an alert displays to let you know it will be created as a report export in the Large Report Download tab.

Clicking OK generates the report and a download link is generated in the Large Report Download tab. To access a report, click Download Report.
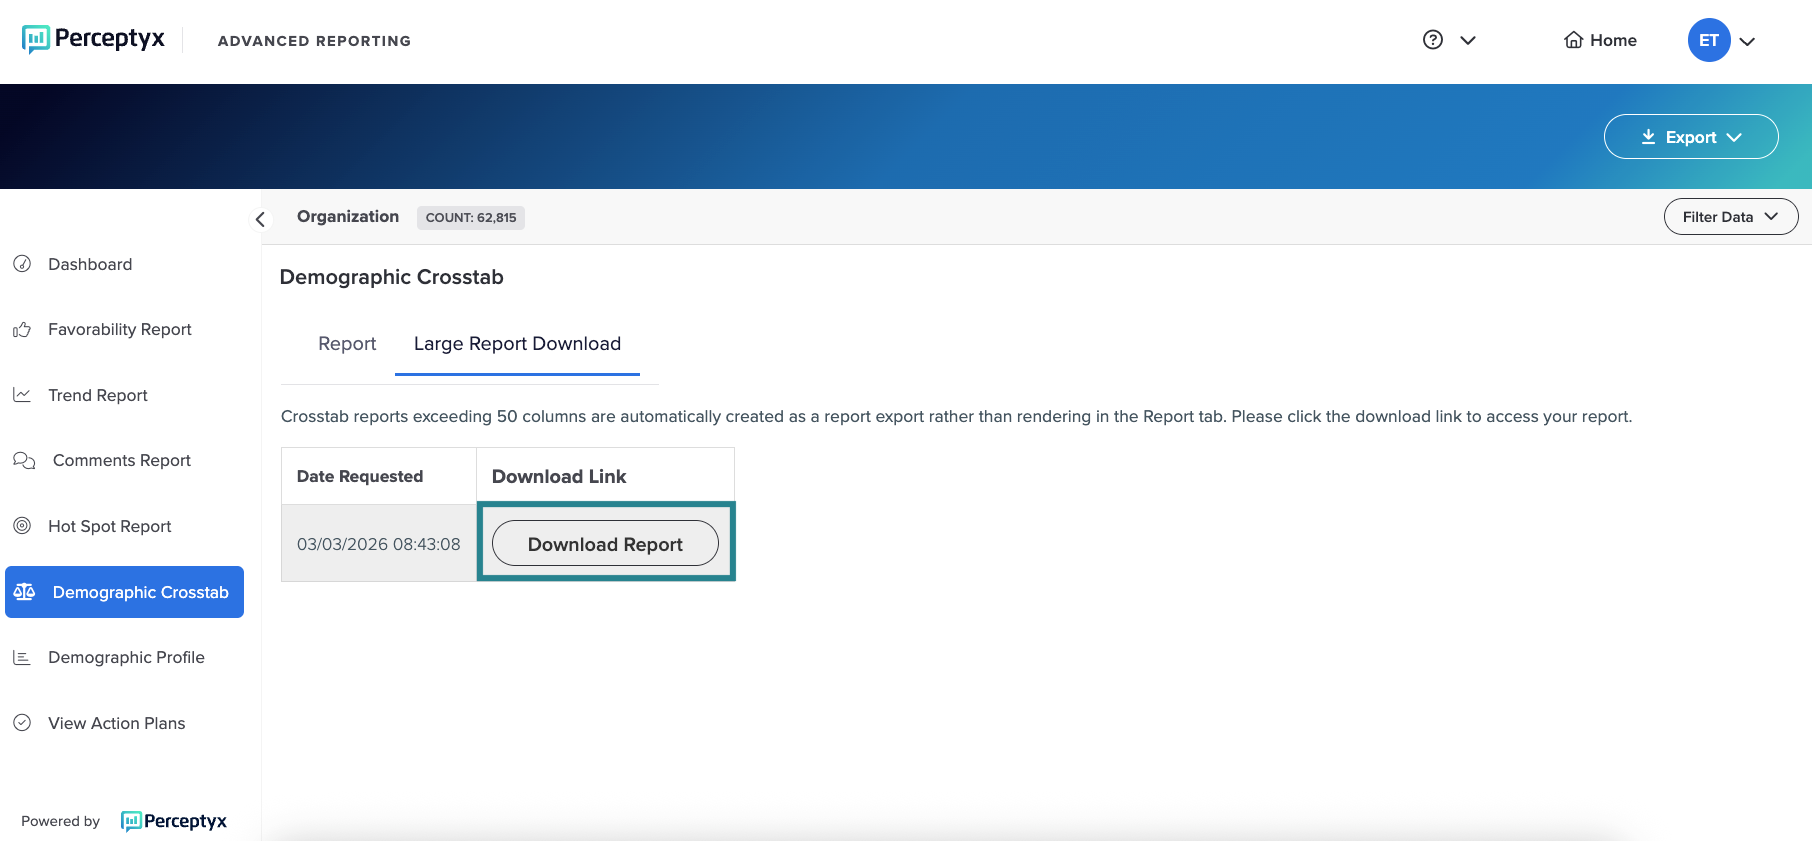
The report is saved to your default download location.
Sample Downloaded Report - Questions

Sample Downloaded Report - Categories


Benchmark Report
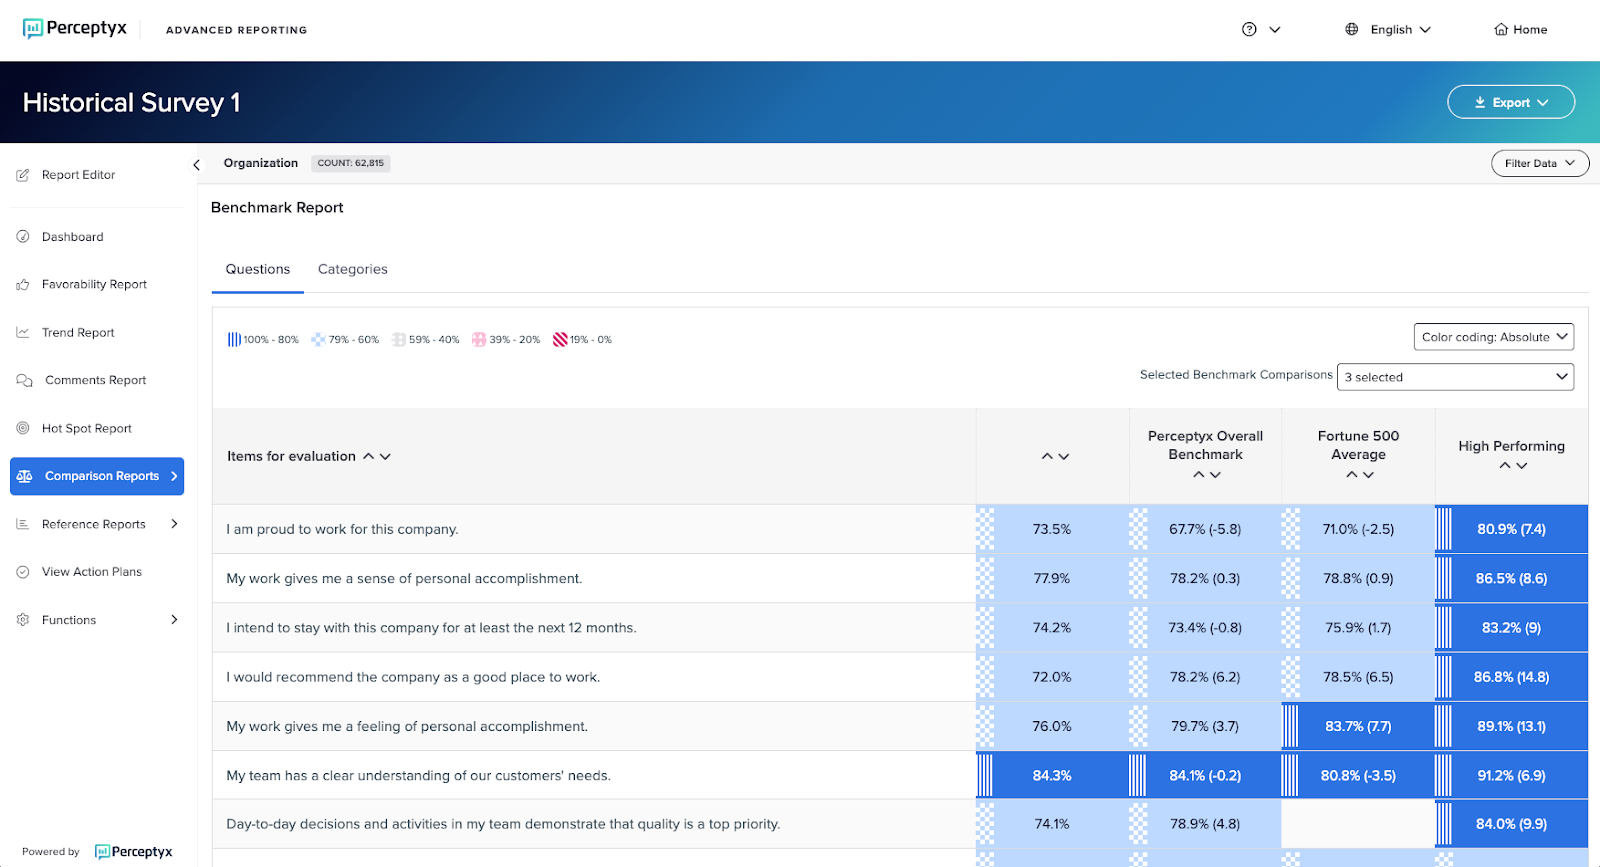
Benchmarks provide valuable context to help guide results interpretation. Benchmarks can answer common questions such as “Is this a normal score? Is it unusually high or unusually low? How do other companies in our industry respond to this type of question?”
The Benchmark Report displays question/category scores compared to benchmark(s) where available. If more than one benchmark is available, you can select the benchmark(s) in the Selected Benchmark Comparisons dropdown (top right).
The Benchmark Report report is available only if your listening event contains items from the Perceptyx Question Library. Available benchmark comparisons depend on which benchmarks your company selects/purchases.
Note: For self-led listening events, the following benchmarks are available:
Perceptyx Overall: EOS - Percent Favorable
Perceptyx Overall: EOS - Percentile 75 - Percent Favorable
EOS: S&P 500 - Percent Favorable
EOS: S&P 500 - Percentile 75 - Percent Favorable
Perceptyx can provide benchmark data in a variety of cuts and measures. To learn more about the Perceptyx Benchmark Database and our benchmark data process, see the Benchmarks article.

Export Option
You can export the Demographic Crosstab Report in Excel format and the Benchmark Report in Excel or PDF format.
- Click Export (top right).
- Select Export PDF or Export Excel.
Was this article helpful?
That’s Great!
Thank you for your feedback
Sorry! We couldn't be helpful
Thank you for your feedback
Feedback sent
We appreciate your effort and will try to fix the article